Ask what a company should spend to acquire a customer and you get four credible answers, all published within eighteen months, all from named research bodies with stated methods. Marketing runs at 7.8% of revenue, or 9.0%, or 13.3%, depending entirely on who was asked. These are not competing estimates of one quantity. They are different quantities wearing one label.
The gap matters most at the bottom. The number that circulates in board decks comes from a sample that is majority billion-dollar companies. Asked of firms under $10M in revenue, the same survey returns a figure more than double the one reported by companies twenty times their size.
Nielsen, 2024 Annual Marketing Report (~2,000 marketers with budgets of $1M+). ANA Programmatic Media Supply Chain Transparency Study, 2023 ($123M of spend, 35.5bn impressions, analysed at log level).
What is inside
- Every published benchmark, with its sample size. Spend as a share of revenue, CAC payback, LTV to CAC by revenue band, and sales-and-marketing efficiency, each cited to a primary source that was opened and read.
- The arithmetic. Which six cost lines belong in the numerator and are routinely left out, and the three defensible denominators that are not interchangeable.
- Five places the number breaks, each with a test you can run yourself in an afternoon, using data already sitting in your ad account and CRM.
- A one-page worksheet. Sixteen inputs. If you cannot fill three of them from a system of record, that is the finding.
- The claims we cut, and why. Six widely circulated figures we traced to their origin and refused to print, including one that would have been our strongest hook.

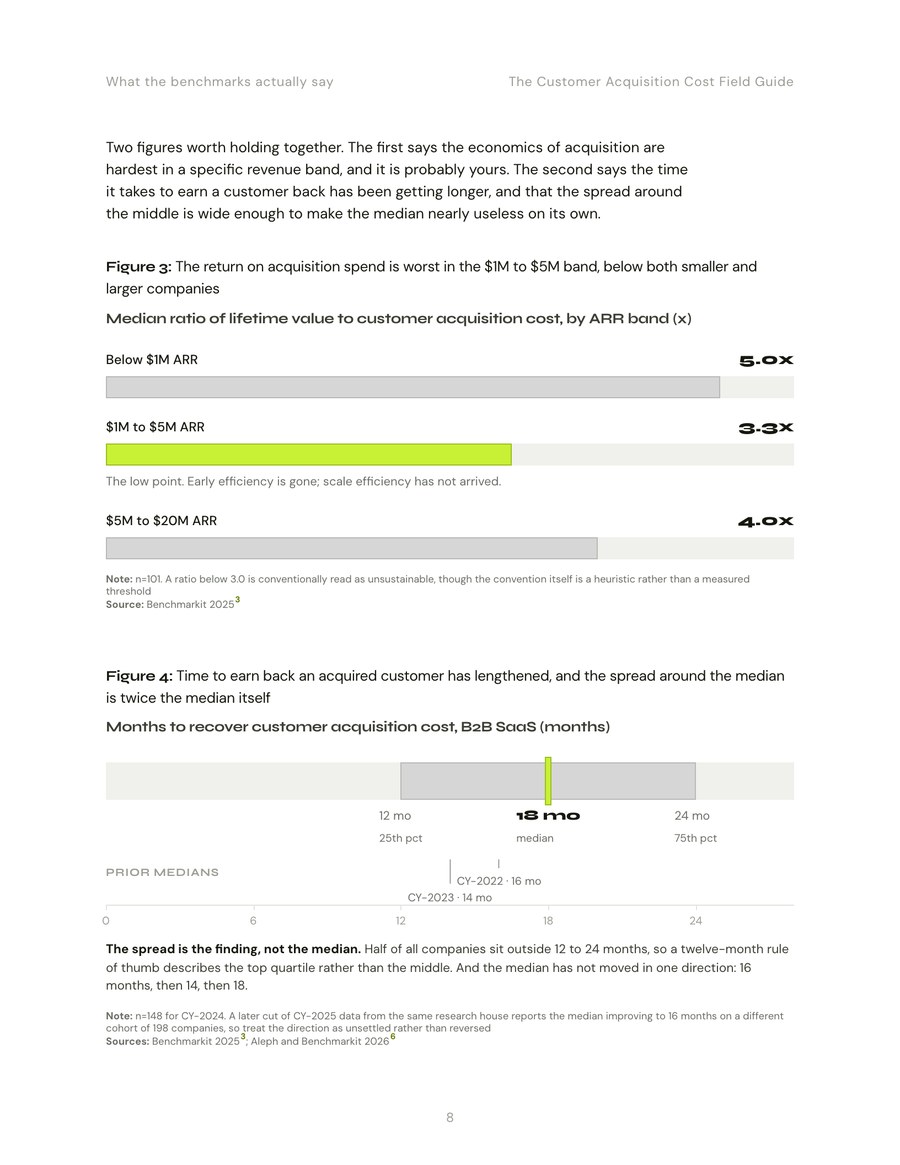
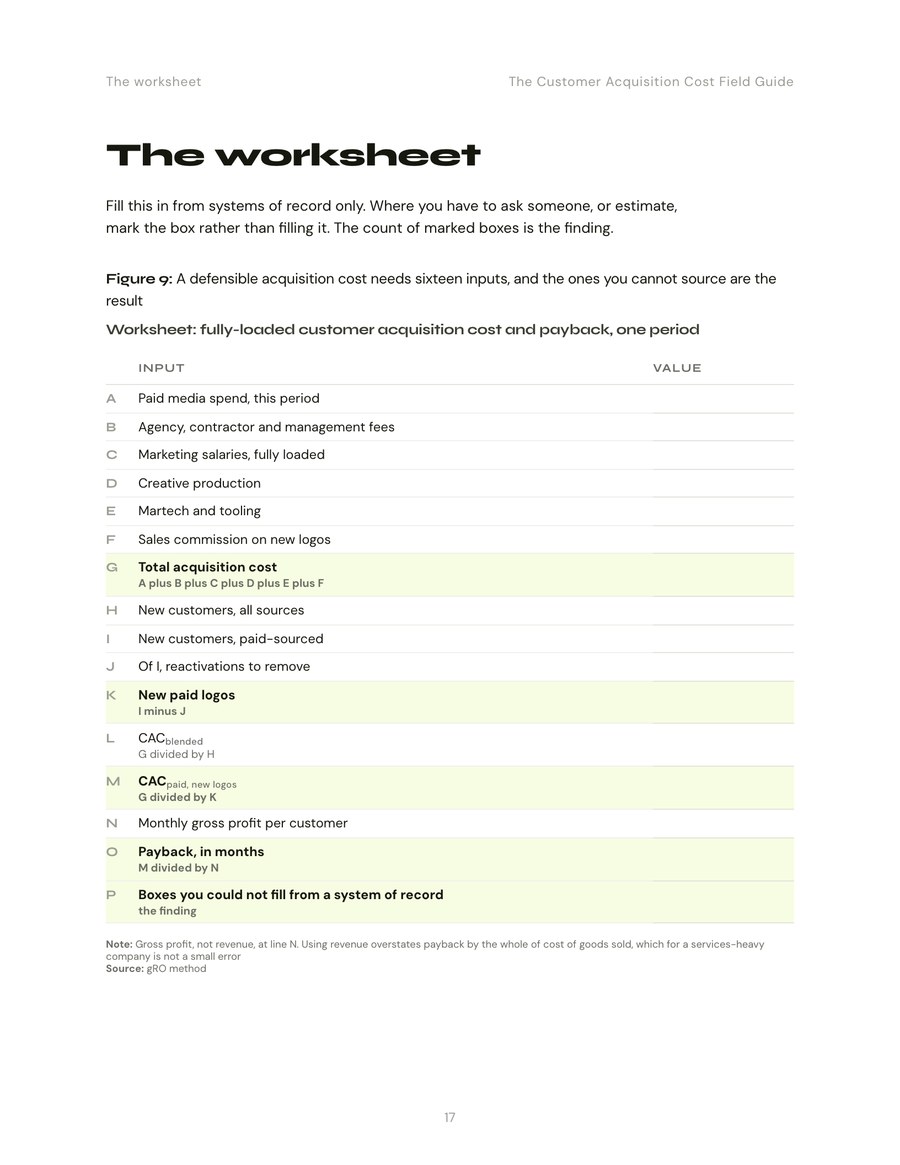
Why this one is different. Most guides assert. This one shows its working. Sample sizes are given at the metric level rather than the headline level, because they are rarely the same figure. Where credible sources disagree, the disagreement is printed rather than resolved toward the more convenient number. And page 19 lists the claims that did not survive verification, including the "spend 7 to 8% of revenue on marketing" rule, which is universally quoted and has no primary source in existence.