Operator-led growth, written down.
Field-tested frameworks for B2B SaaS founders scaling $1M–$10M ARR. Each article expands a single idea from the gRO playbook — read the one that maps to what you're fighting today.
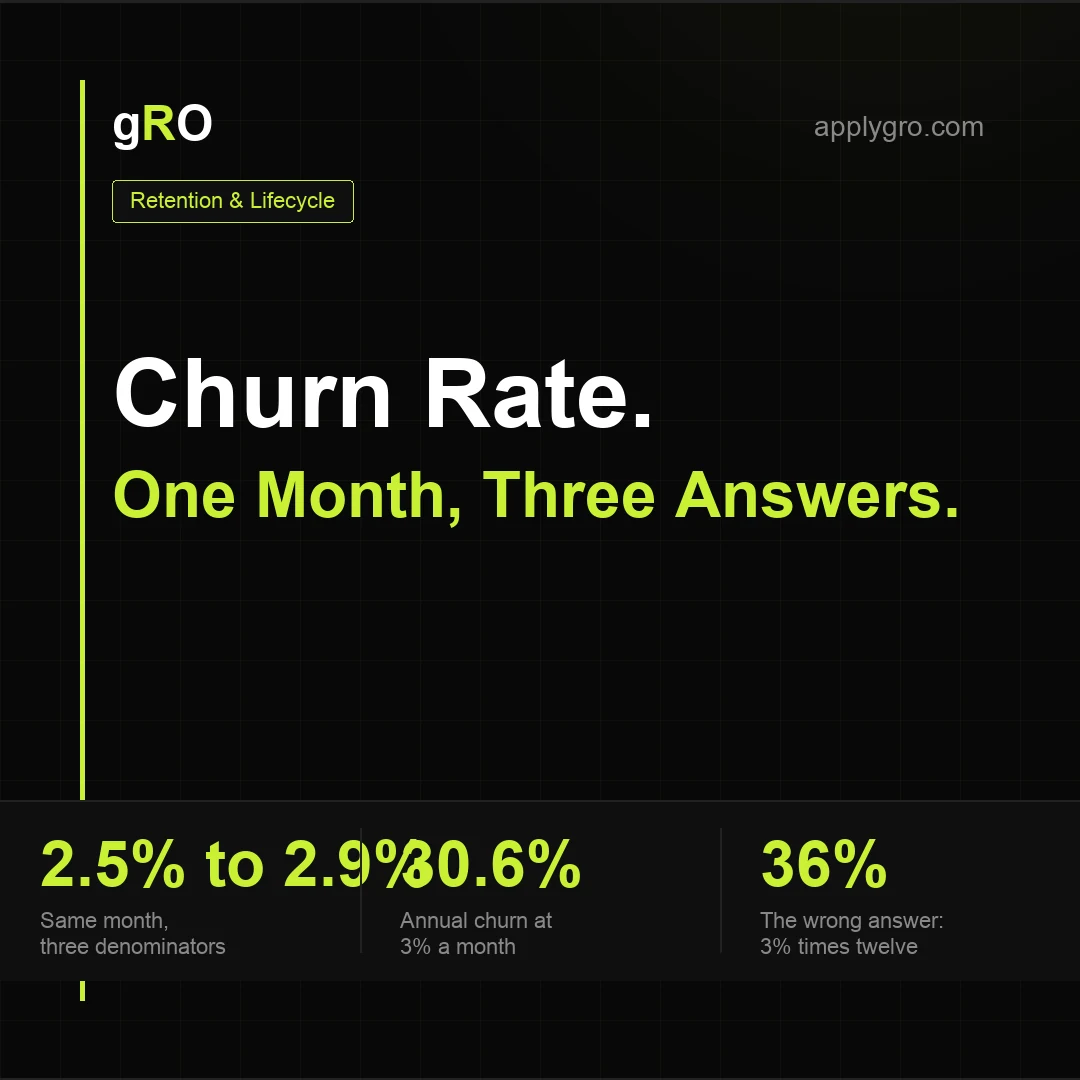
Churn Rate: What It Means and Why One Month Has Three Answers.
Customer churn rate is the share of paying customers lost over a period, but the same month gives different answers under different denominators. The formula, a worked example with three methods, cohort churn, monthly to annual conversion, and the edge cases to settle first.
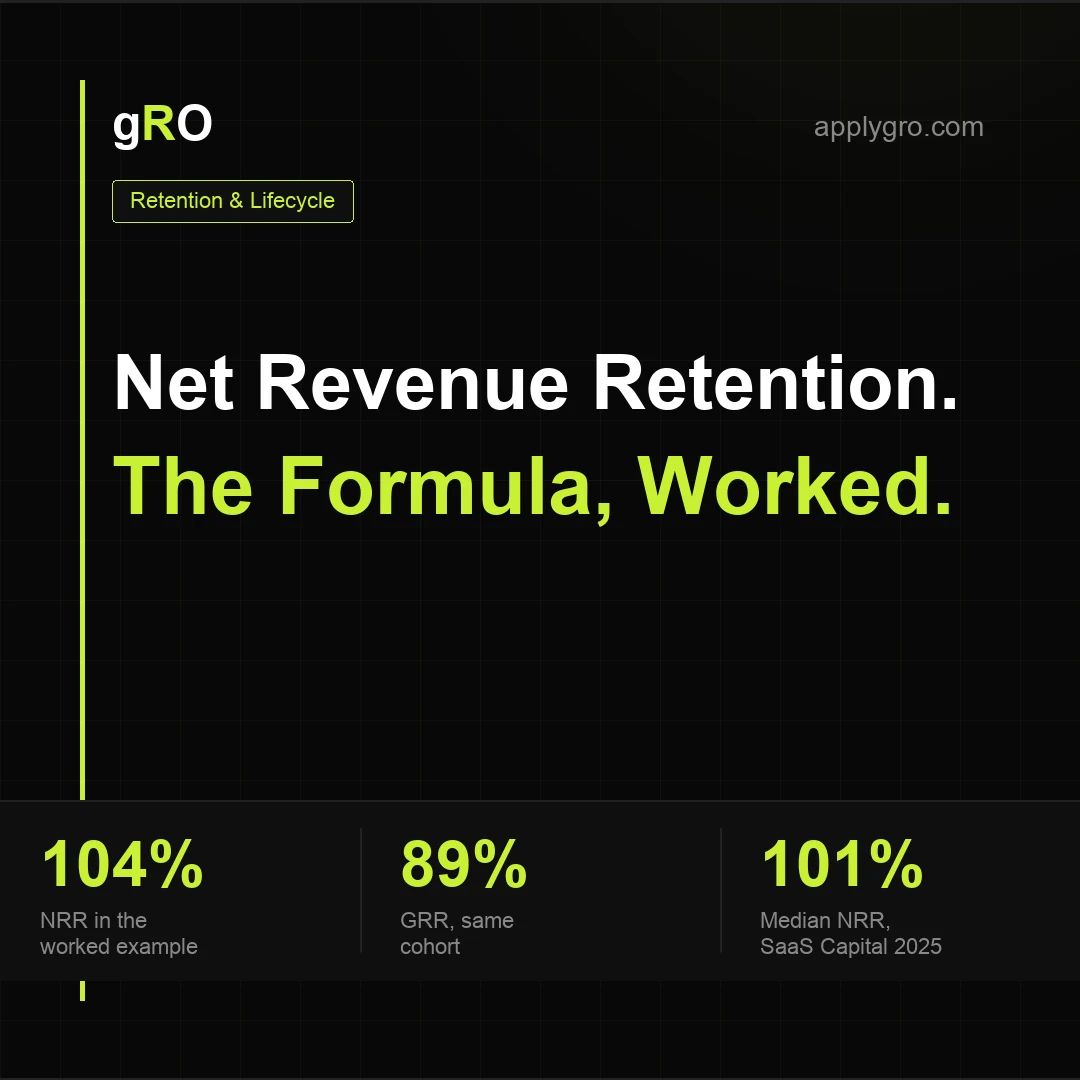
Net Revenue Retention: What It Means and How to Calculate It.
NRR is the share of a cohort's starting recurring revenue still there a year later, with expansion added and new customers left out. The formula, a worked example, the four errors that inflate it, 2025 benchmarks by ARR band, and a calculator.
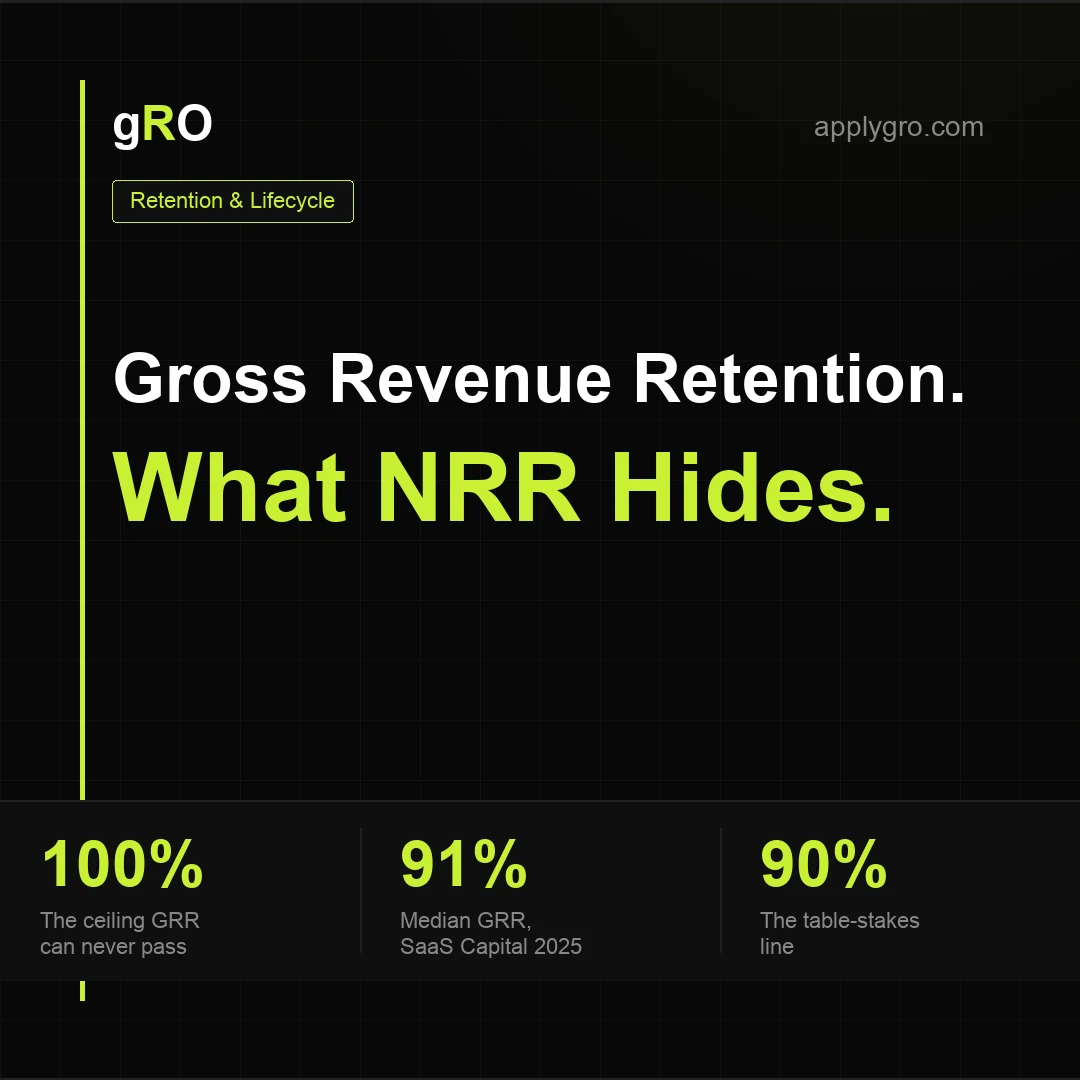
Gross Revenue Retention: The Formula, and What It Shows That NRR Hides.
GRR is the share of starting revenue kept after downgrades and churn, with expansion left out, so it can never pass 100%. The formula, a worked example, GRR vs NRR side by side, 2025 benchmarks, and the four things that drag it down.
Go-to-Market Strategy Is Five Decisions, Not Forty Slides
Segment, claim, channel, motion, economics. Each one has a failure mode attached, and the right-hand column of that table is a diagnostic: when growth is stuck, the symptom names the decision you skipped.
The GTM Engineer, and Why Nobody Can Tell You What It Pays
The five systems the role owns, how it differs from marketing ops and growth engineering, whether you need to code, and an honest answer on comp: the title is too new for a credible band, so price it from the inputs.
Four Funnel Stages, One Metric Each, and Where the Money Leaks
Ten thousand sessions produce three customers. Doubling traffic and doubling the money-page conversion rate both get you six, but one costs a doubled media budget every month and the other costs a week of work once.
A Customer Journey Map That Changes What You Ship Next Week
Six columns, one day, and evidence pulled before anyone opens a whiteboard. Most maps die because they cover every customer type at once, run on assumptions, and give no gap an owner.
A Positioning Statement That Survives Your Sales Calls
Write the opposite of your statement. If no serious company would ever claim it, yours asserts nothing. The four-slot template, three worked examples, and why hyperbole cannot constrain anything.
The Three Jobs AI Does Well in Marketing, and the Three It Doesn't
Organised by job rather than by vendor, because the vendor list turns over every quarter and the jobs do not. Plus the one question that disqualifies most AI marketing platforms in about a minute.
Google Ads or Meta First? One Check Settles It.
Capture versus creation, decided by pulling real search volume rather than by opinion. Plus the measurement mistake that makes both channels look like they are failing when only one of them is.

Six Marketing Practices, Not Four Ps
The six working practices a revenue team runs on, what each looks like when a team actually does it, and exactly what breaks when one is missing. The 4 Ps are a 1960 checklist, not an operating manual.
21 Types of Marketing, and Which Ones You Should Skip
Every distinct marketing motion in four buckets, each with a plain verdict: use it when, skip it when. Written for teams under ten people who cannot run all 21 and should not try.
Growth Marketing, Defined by Someone Who Owns the Number
Most definitions were written by people who have never carried a pipeline number. A campaign that doubled traffic while CAC rose 40% is a failed campaign in this discipline, full stop.
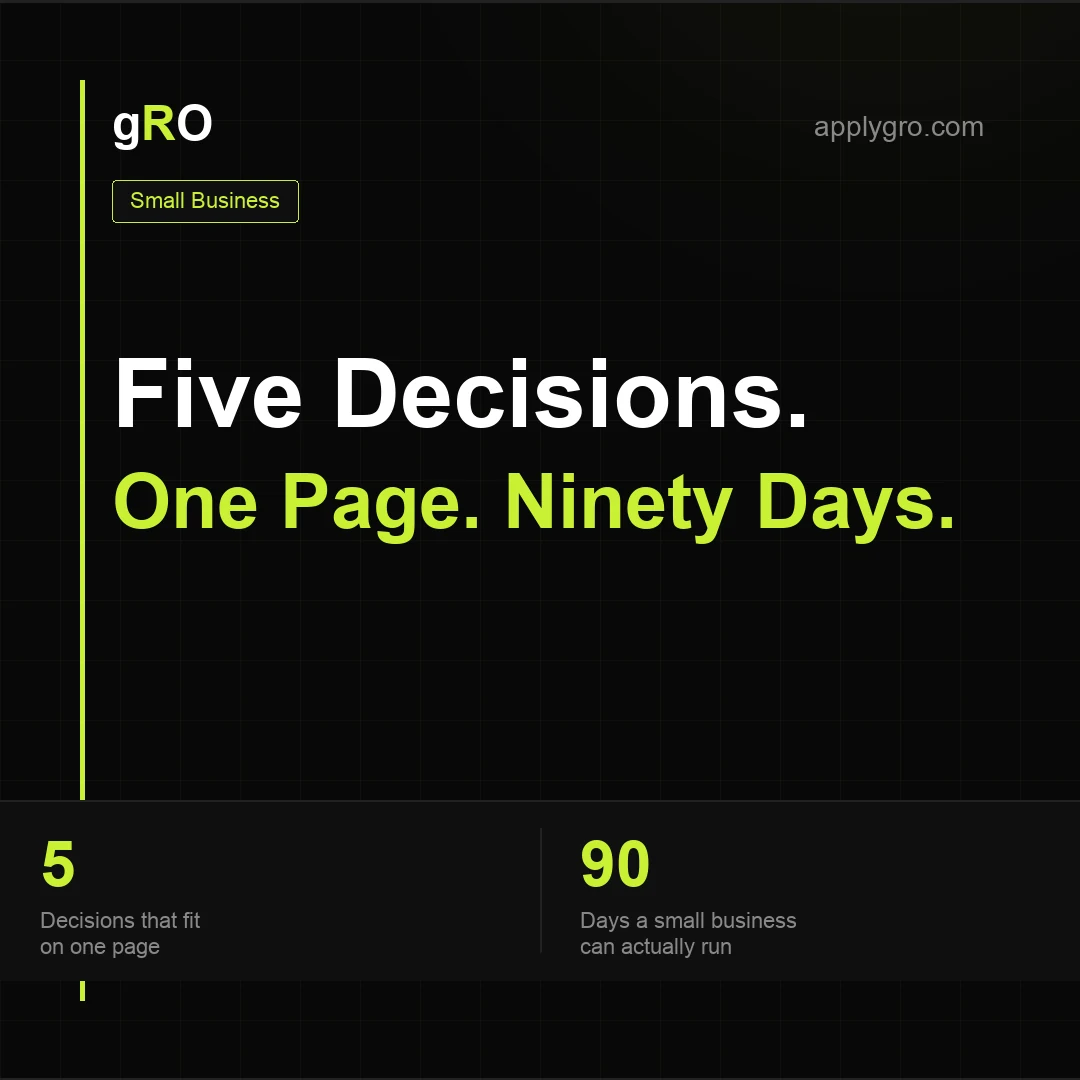
The One-Page Marketing Strategy for a Business That Cannot Waste a Dollar
Five decisions, one page, ninety days. No 40-slide plan and no channel buffet — just the framework a small business can actually run, including what to do with no budget at all.
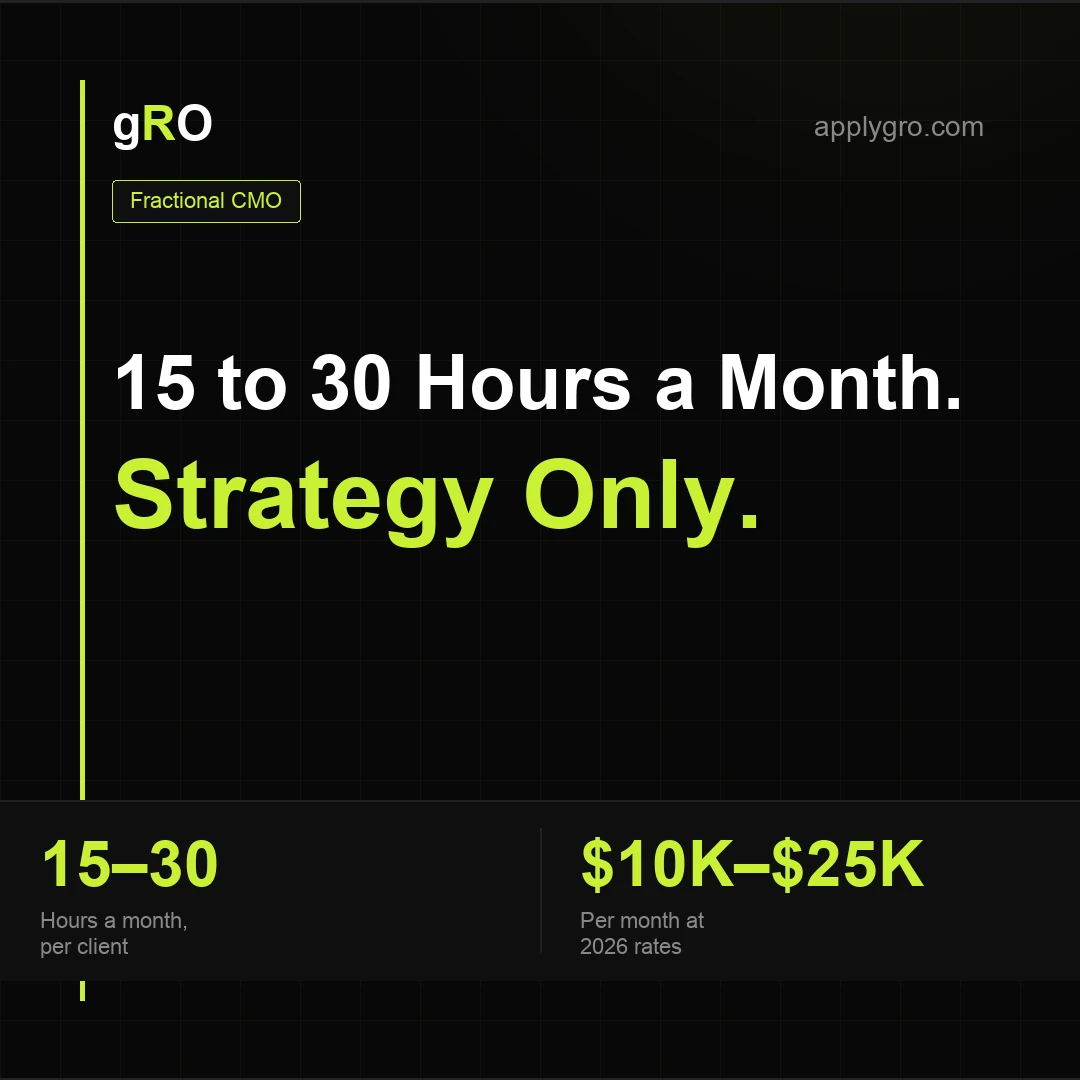
What a Fractional CMO Actually Does All Month
The plain-English definition, a real month of the work broken out hour by hour, and the structural limit nobody prints on the sales page: strategy is included, execution is not.
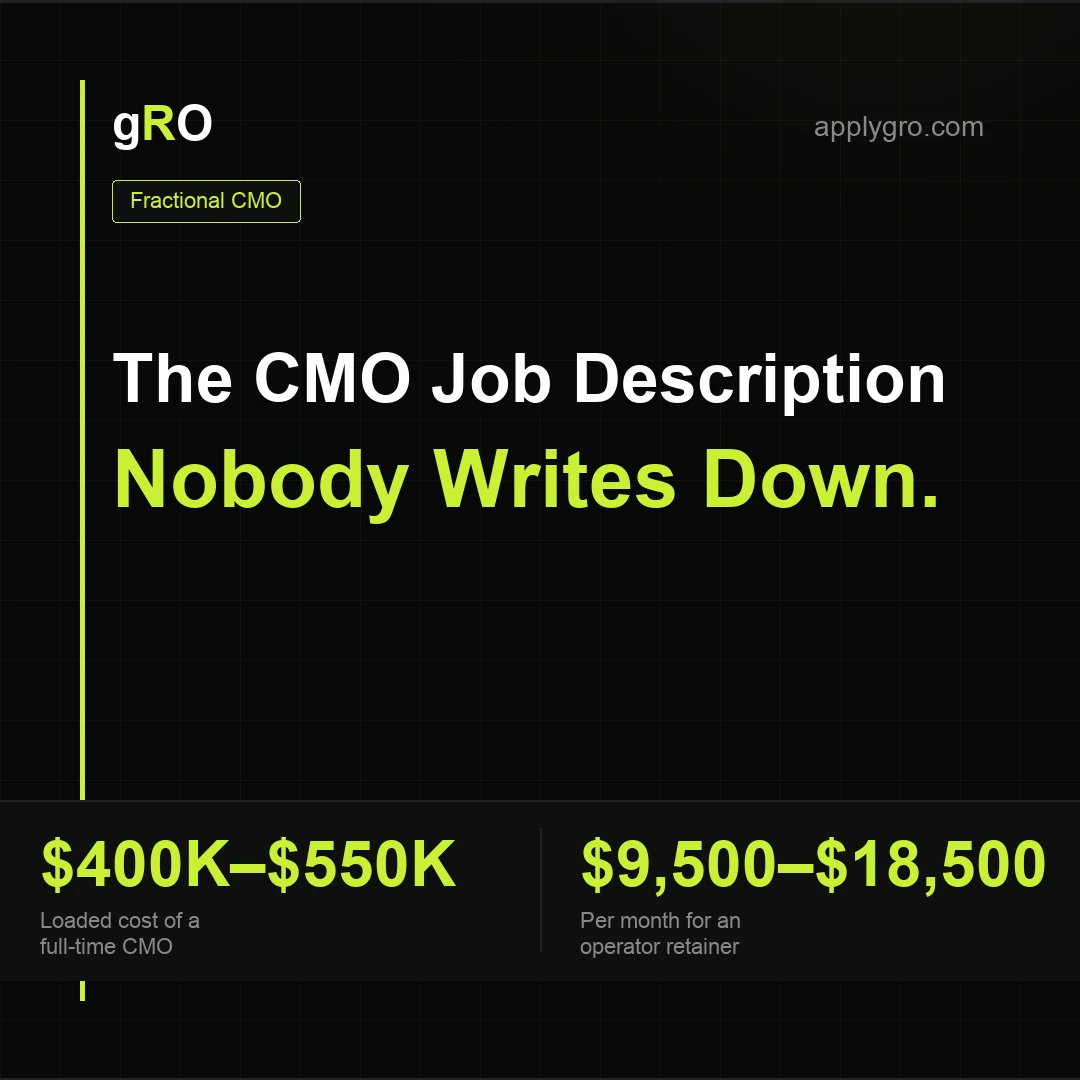
The CMO Job Description Nobody Writes Down
Revenue narrative, org design, budget allocation, board reporting. The real chief marketing officer job, and a table showing who actually does the hands-on work once you have hired one.
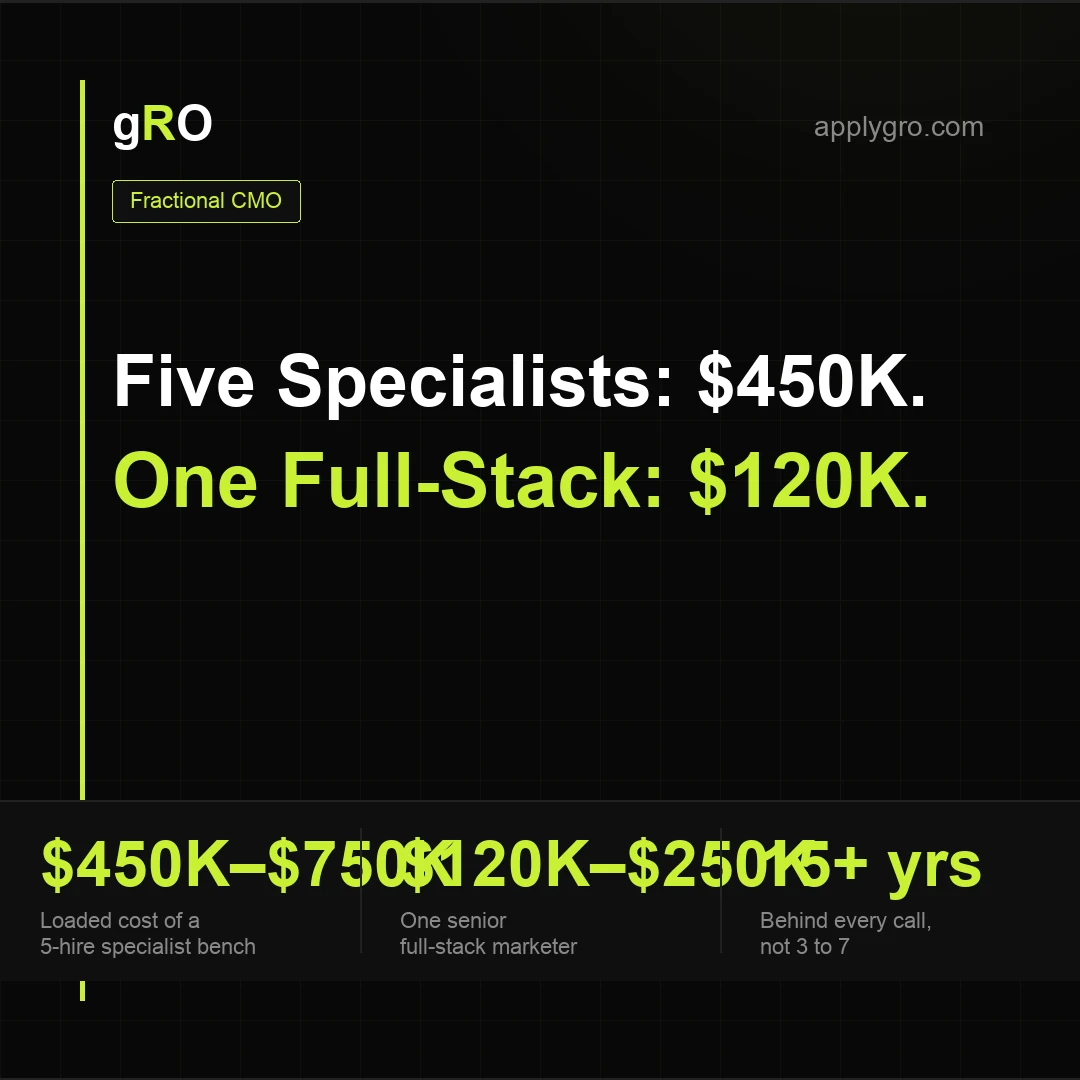
Five Specialists at $450K, or One Full-Stack Marketer at $120K
The name for a marketer who covers the whole stack, the six systems they have to run, and the 2026 economics of one senior generalist against a bench of five specialists.

The T-Shaped Marketer Is Widening Into a Full Stack
The definition, the classic skill map, and the 2026 thesis: AI collapsed the cost of breadth, so the T is widening for anyone with the depth to direct it.
The Future of Marketing: What 2027 Looks Like From Inside the Work
Four eras of marketing, five falsifiable predictions for 2027, and what the shift means for agencies and for jobs — written by an operator running the model, not forecasting it.
Will AI Replace Marketing? No, But the Teams Are Being Rebuilt
A task-by-task answer from someone running an AI agent fleet daily: what AI does well unattended, what it does only under supervision, and the three things it cannot do at any price.
The Future of SEO: One Query Stream Becomes Three
Search is splitting into three surfaces that reward different work. What ranks on each, what stays true underneath all of them, and the one thing worth doing before the split finishes.

What Marketing Agencies Charge in 2026, Every Model Decoded
The complete 2026 rate card: retainers, hourly, project fees, percentage of spend and performance deals, with what each model costs, what it actually buys, and who it quietly favours.
Is a Marketing Agency Worth It? The Math Nobody Selling One Will Do
You are probably here mid-doubt: about to sign, or about to fire. This runs the actual numbers, gives you the three questions that predict the outcome, and saves the pitch for the very end.

In-House vs. Agency: Run the Numbers Before You Pick a Side
One loaded-cost table, five columns nobody puts side by side — monthly cost, senior time, execution, ramp, walk-away risk — then an honest accounting of what each option really buys.

Hiring a Small Business Marketing Consultant? Read This First
The rates, the deliverables that actually matter, and the five questions that separate a consultant who moves revenue from one who sells you a deck and disappears.
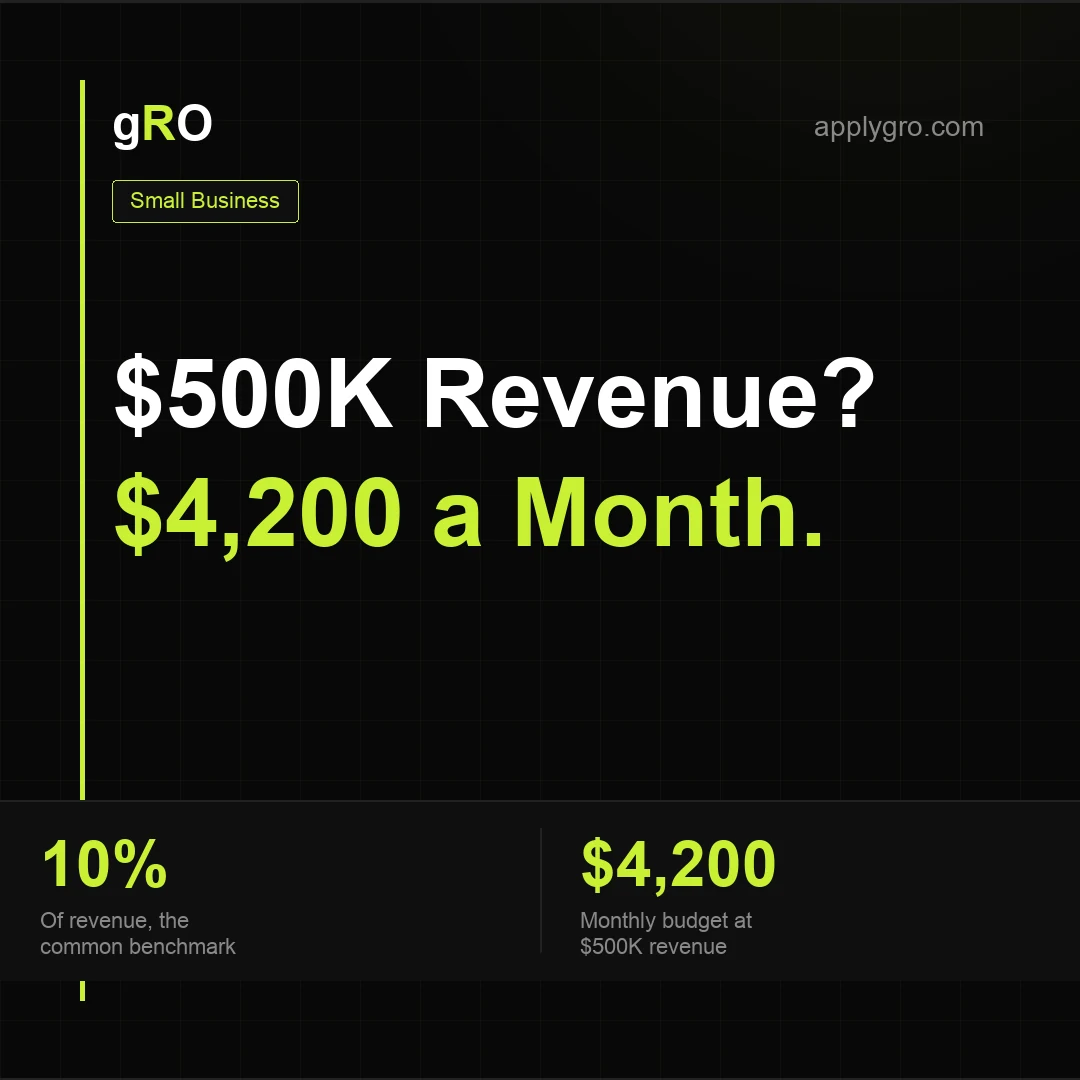
How Much Should a Small Business Spend on Marketing?
Benchmark percentages by revenue band, what those dollars actually buy at your level, and a calculator that turns annual revenue into a monthly number you can defend.

The Outsourced CMO: One Term, Three Very Different Purchases
What each shape of CMO outsourcing costs in 2026, what each one actually delivers, and exactly where the execution gap opens once the strategy is handed over.
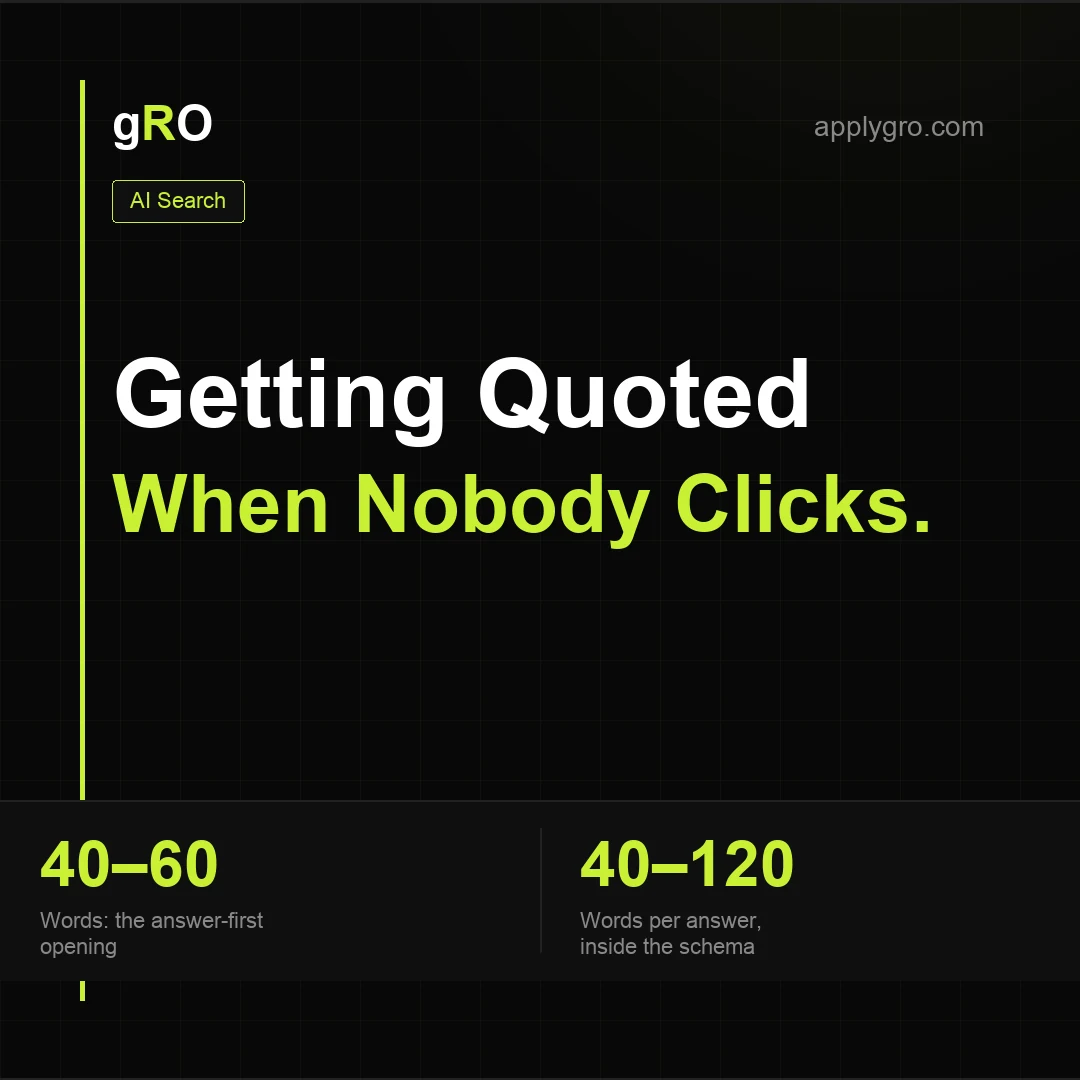
Answer Engine Optimization: Getting Quoted When Nobody Clicks
Written from practice rather than theory — we run AEO on our own live sites, with llms.txt, entity linkage and answer-first pages in production. Here is the method and its limits.
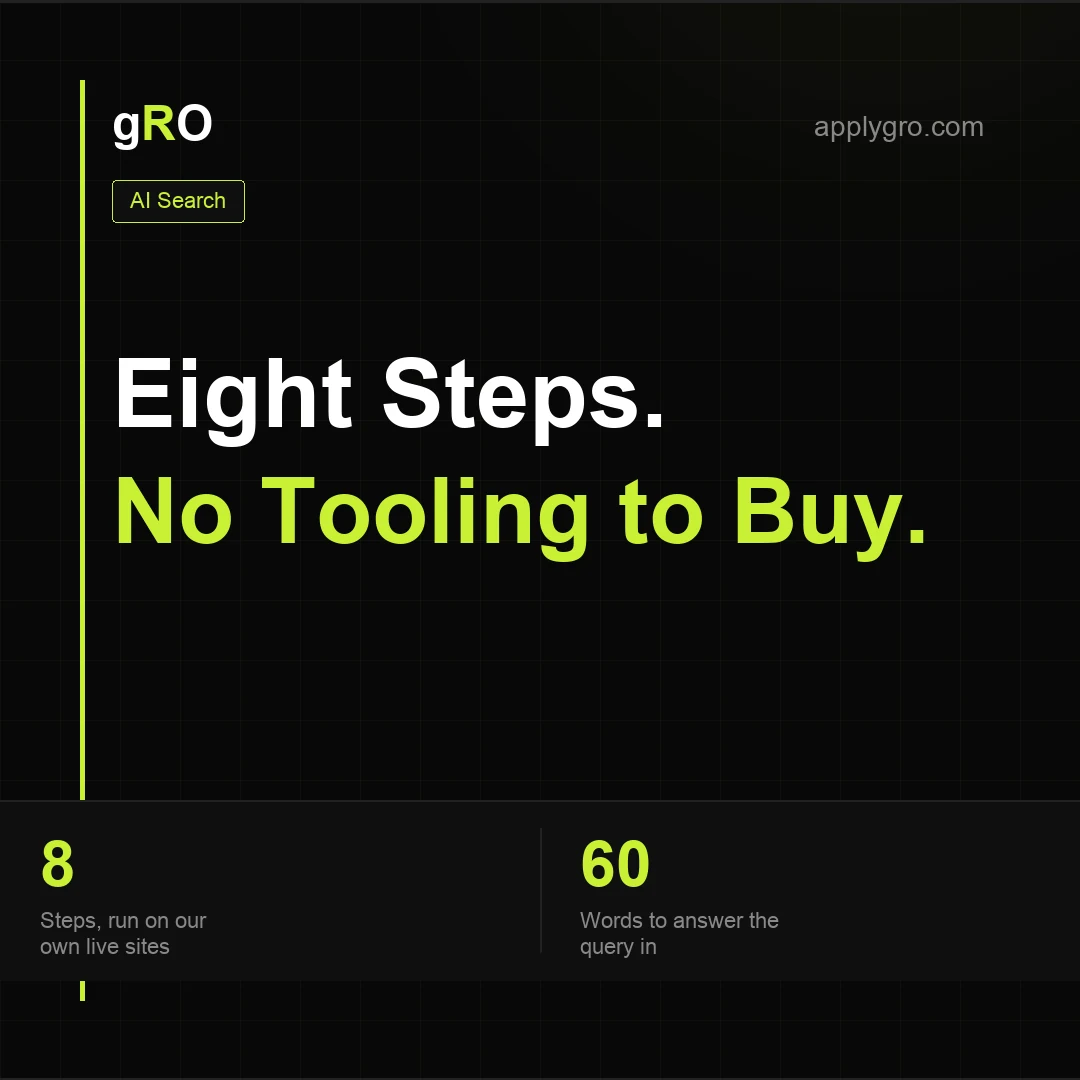
How to Rank in AI Overviews (and Show Up When ChatGPT Answers)
Eight steps in plain language that raise the odds an AI engine quotes your business instead of a competitor. No tooling to buy — this is the method we run on our own sites.
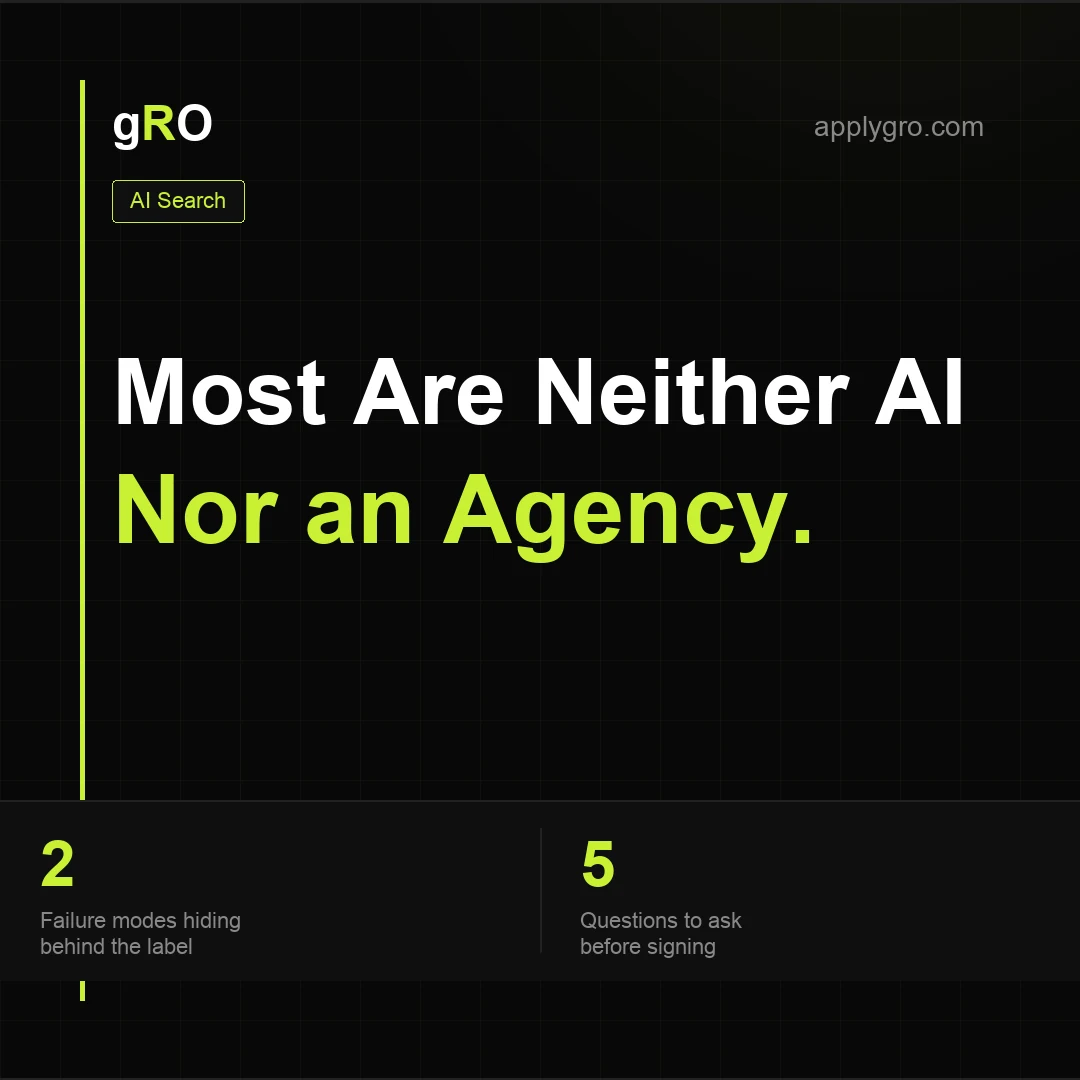
Most AI Marketing Agencies Are Neither AI Nor an Agency
The label is unregulated and the market knows it. What the term should mean, the two failure modes hiding behind it, and the five questions that separate the real from the wrapper.
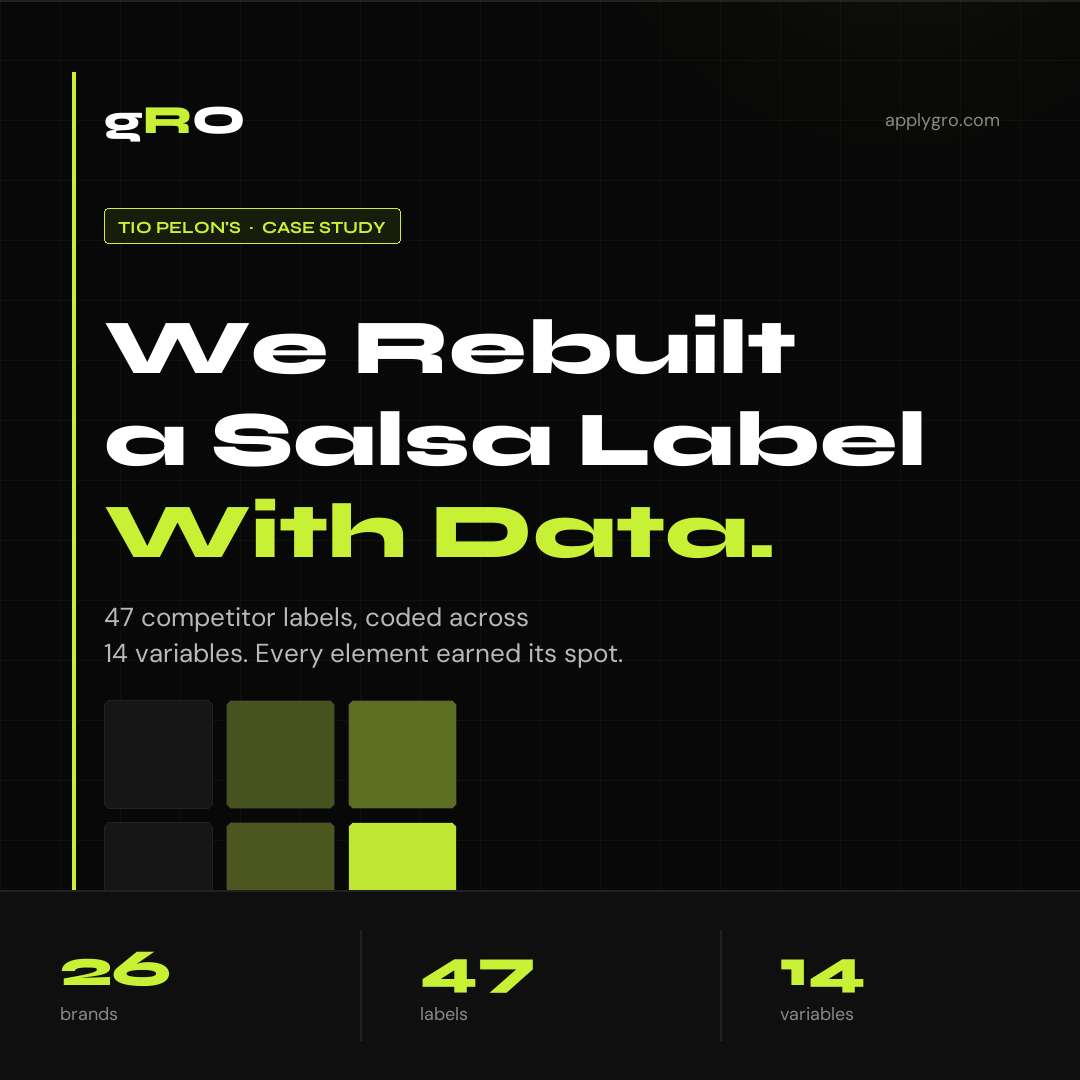
How We Redesigned a Salsa Label Against 47 Competitors
26 competitor brands pulled off the H-E-B shelf, 47 labels coded across 14 design variables, and one unclaimed position nobody had taken. How gRO rebuilt a San Antonio salsa brand's packaging on category data instead of taste.
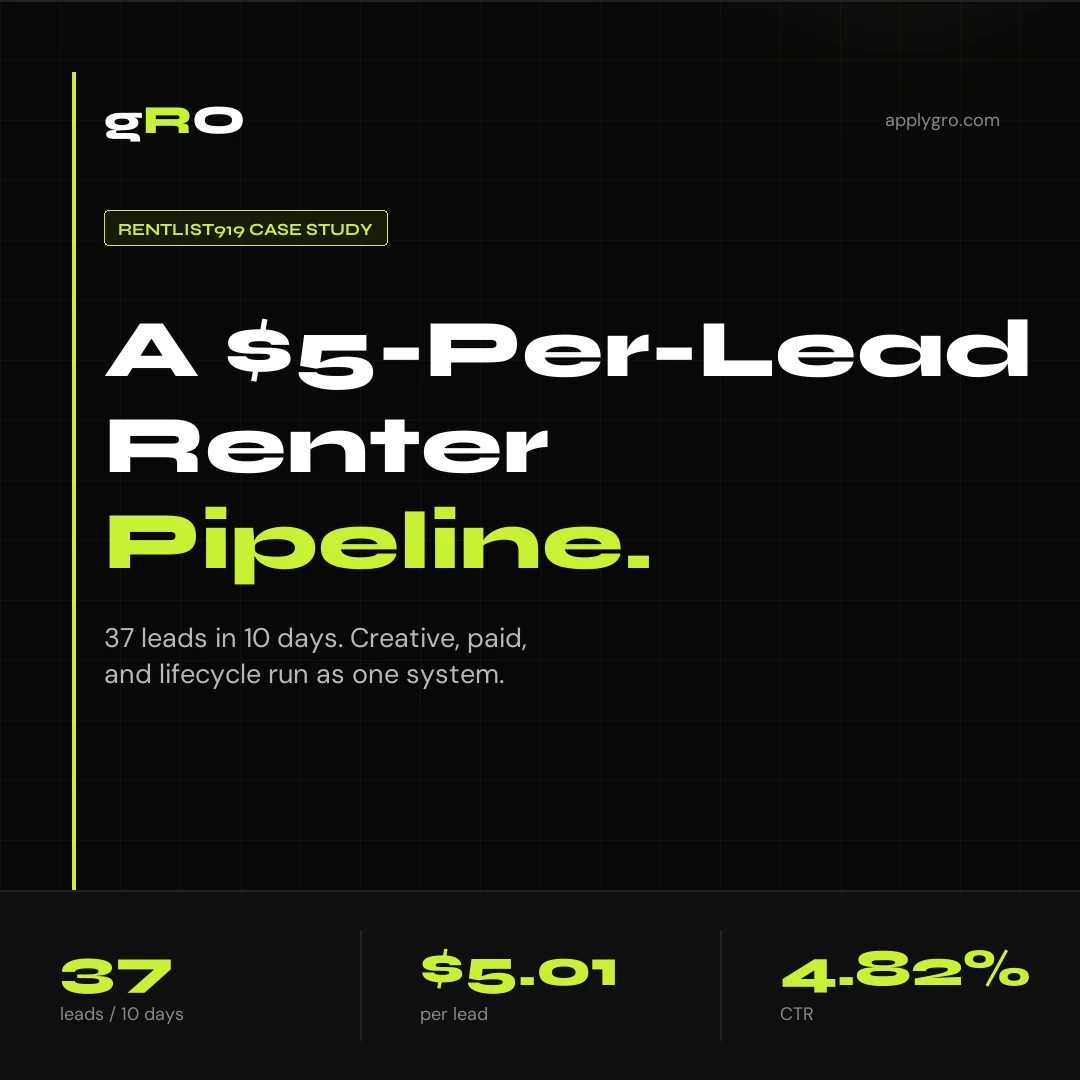
How We Built RentList919 a $5-Per-Lead Renter Pipeline
37 renter leads in 10 days at $5.01 each and a 4.82% CTR. How gRO ran creative, paid, and lifecycle as one connected system for a Triangle rental brokerage.
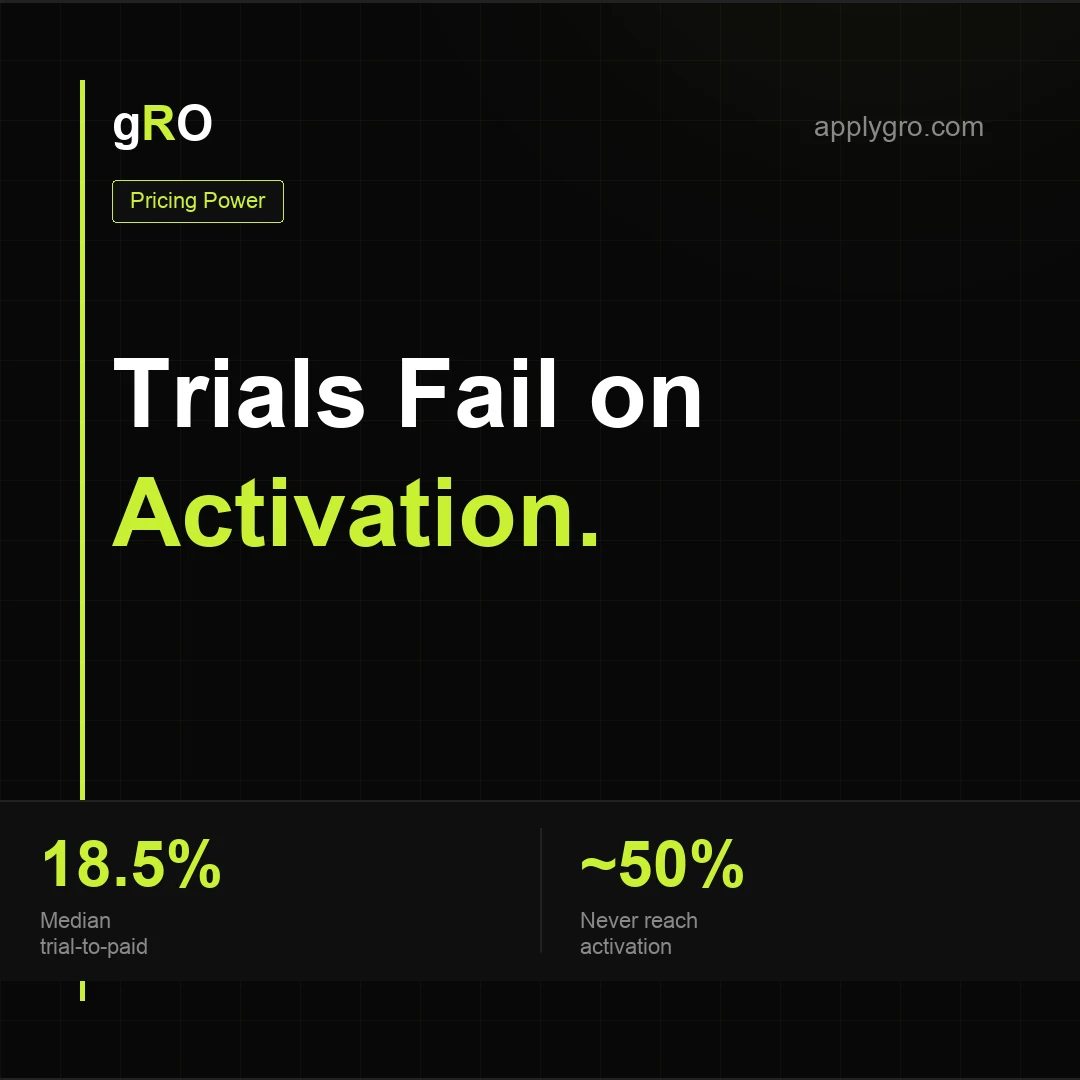
Your Free Trial Doesn't Fail on the Product.
Median B2B SaaS converts ~18.5% of trials, and ~half of trial users never reach activation. Why onboarding — not the product — decides trial conversion.
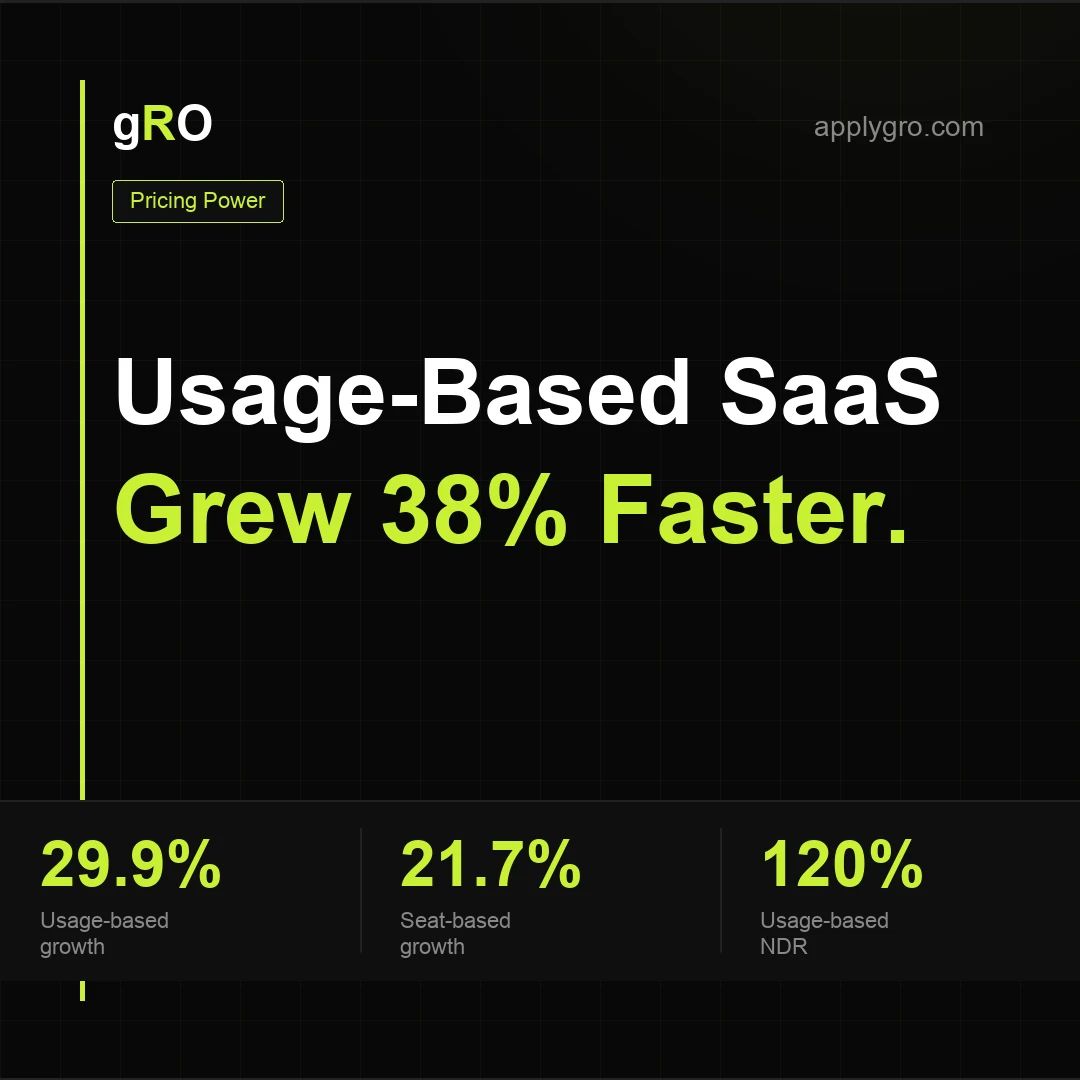
Usage-Based SaaS Grew 38% Faster.
Across ~600 SaaS companies, usage-based pricers grew 29.9% a year vs 21.7% for seat-based, with ~120% vs ~110% NDR (OpenView). Why pricing model caps your growth.
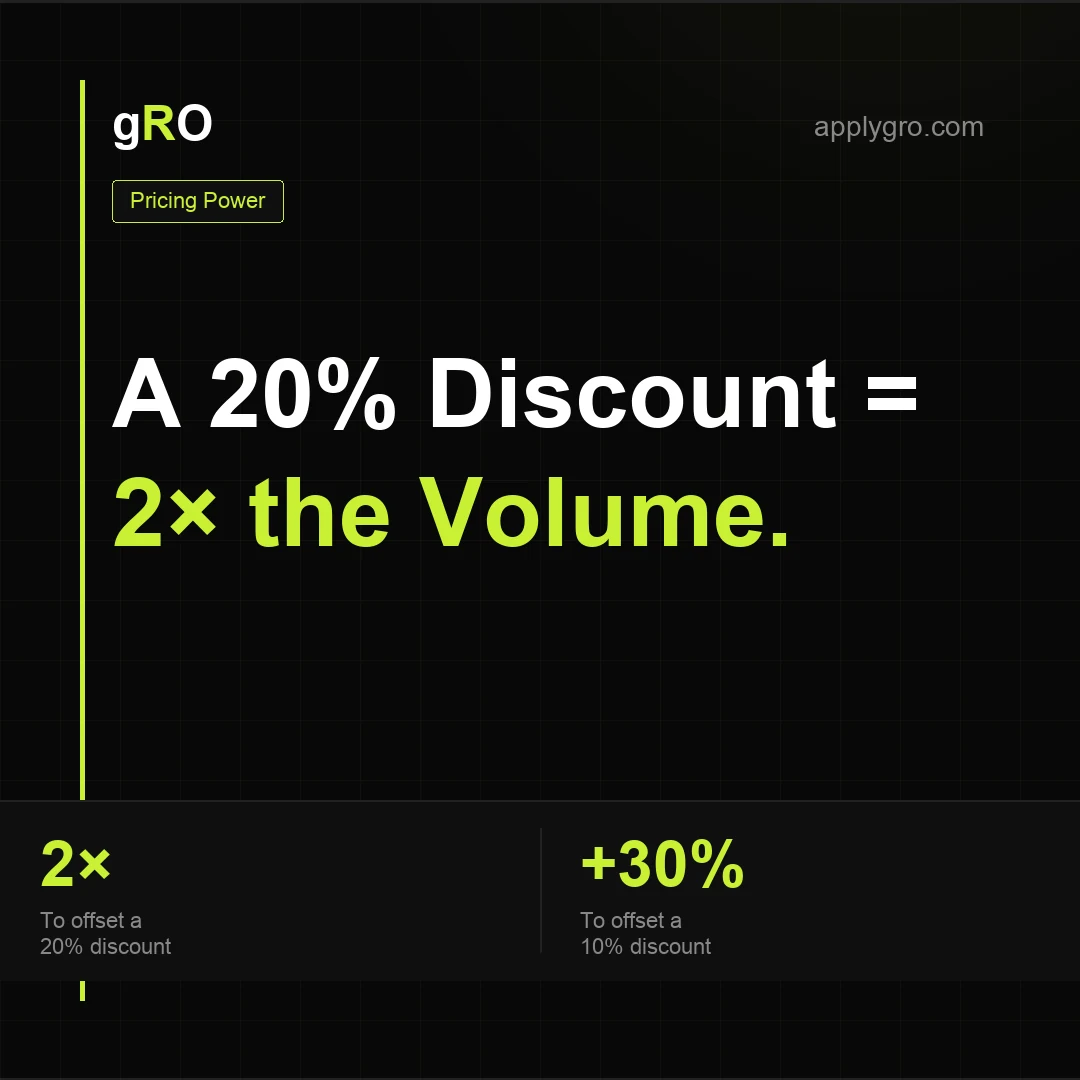
A 20% Discount Means Selling 67% More.
At a 50% gross margin, a 20% discount forces you to sell 67% more just to break even on profit — push it to 25% and you're selling double. Every discount trains buyers to wait. The contribution-margin math.
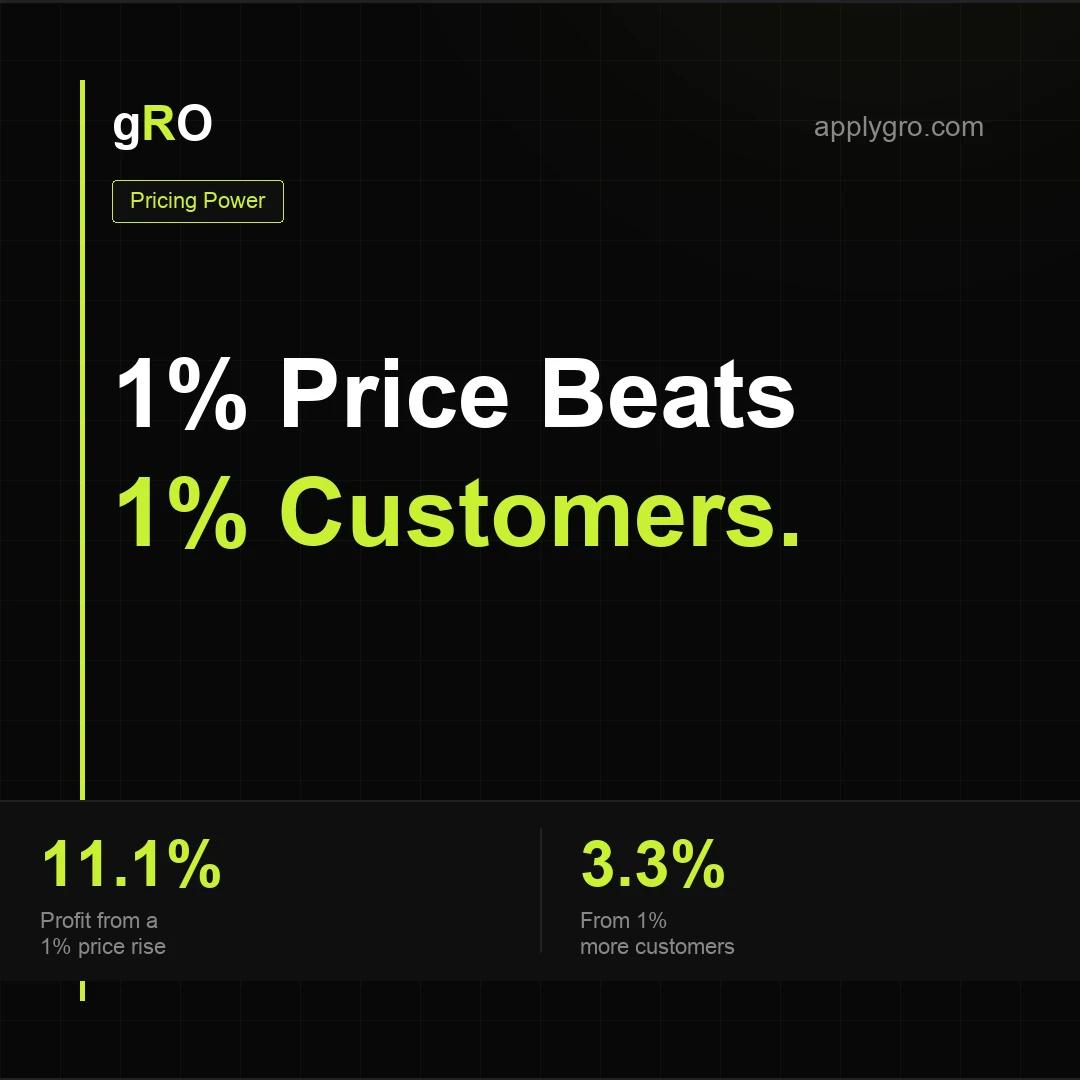
A 1% Price Increase Beats 1% More Customers.
The classic McKinsey finding: a 1% price increase raises operating profit 11.1%, vs ~3.3% from a 1% gain in customers. Why founders under-use the most powerful lever they have.
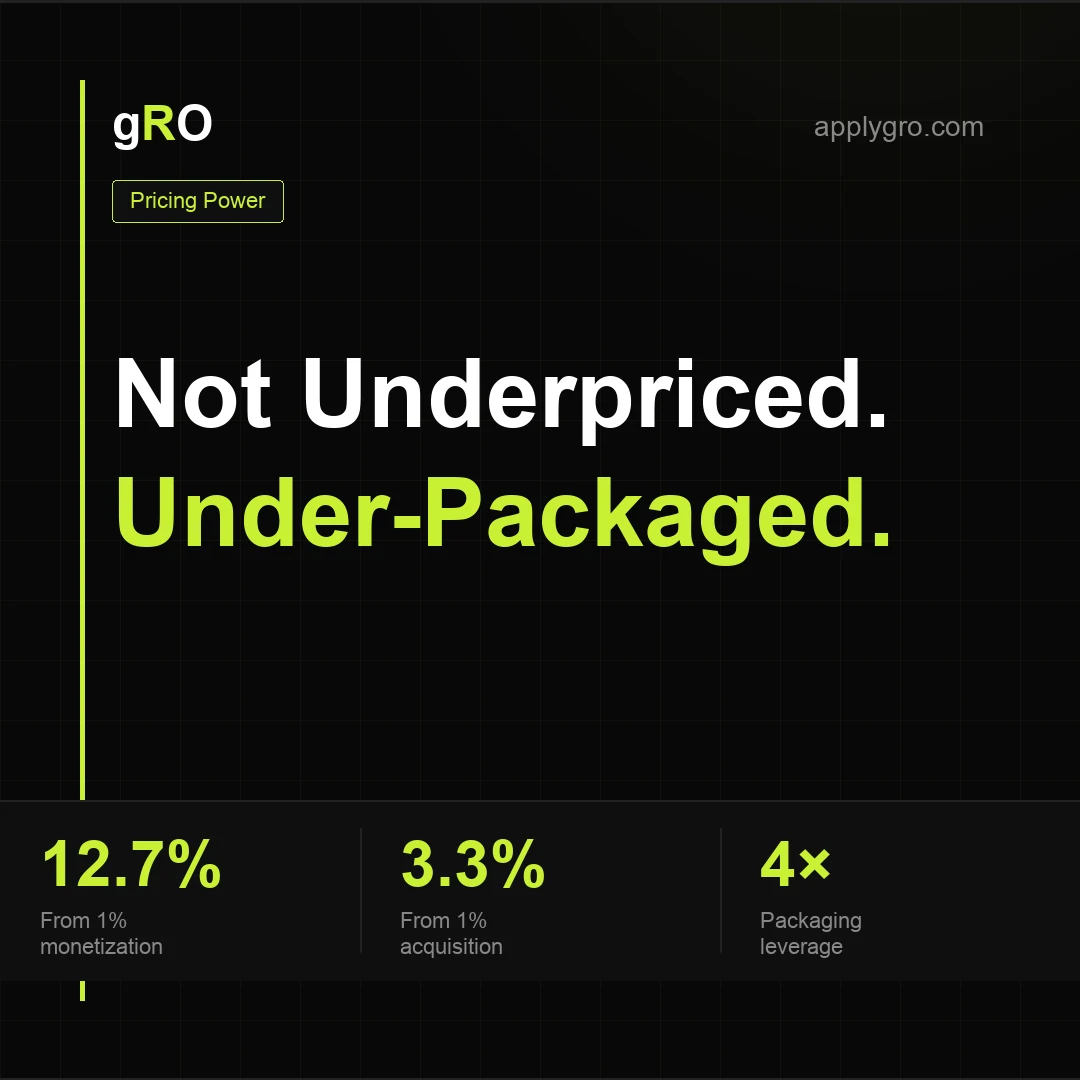
Under-Packaged, Not Underpriced.
Across 512 SaaS companies, a 1% gain in monetization moved the bottom line 12.7% vs 3.32% for acquisition. Why packaging beats buying more customers — and how to fix it.
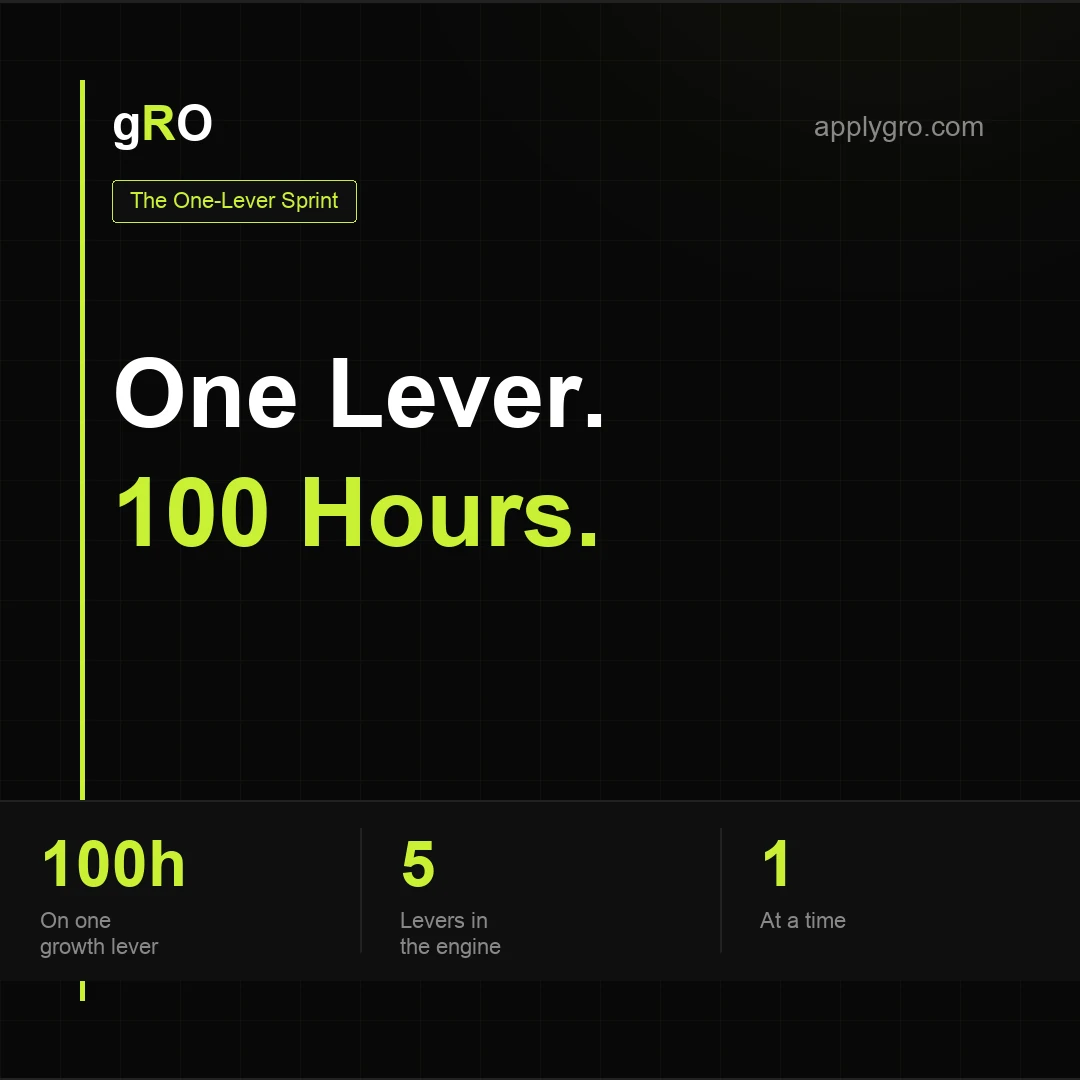
The 100-Hour Growth Sprint.
A growth sprint is roughly 100 hours of focused effort on one lever — audience, engagement, conversion, brand, or retention. Why compounding focus beats spreading thin.
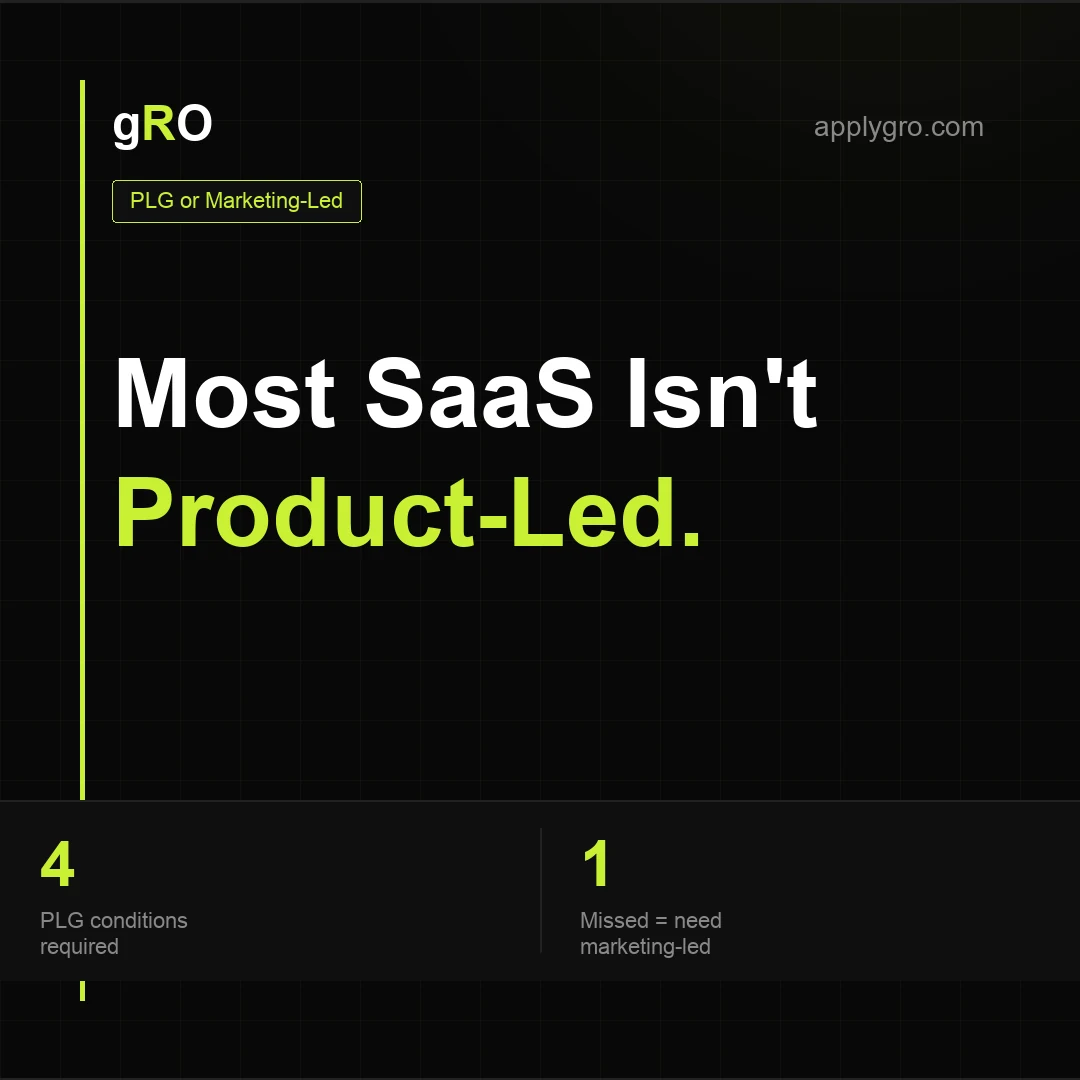
PLG vs Marketing-Led Growth.
Product-led growth only works under four conditions. Most $1M–$10M B2B SaaS miss at least one — which means the product won't sell itself and marketing has to drive demand.

Buyer Momentum.
At any moment under 10% of your audience is ready to buy, and the average B2B buyer needs 10+ touchpoints first. Why consistency beats one-shot campaigns.
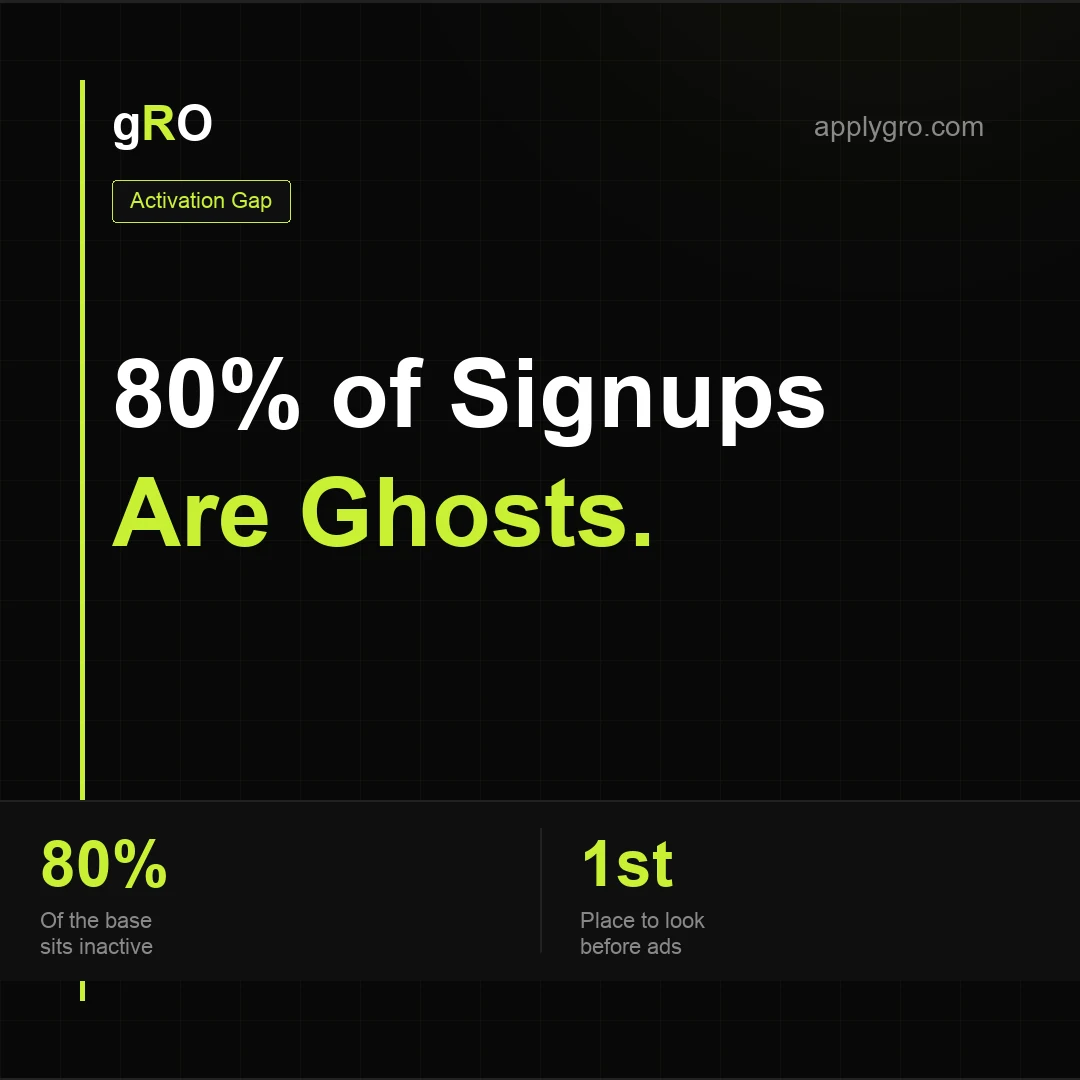
The Activation Gap.
In a typical SaaS base, up to 80% of signed-up users are inactive. Reactivating them is cheaper than acquisition — how to close the activation gap with lifecycle, not ad spend.
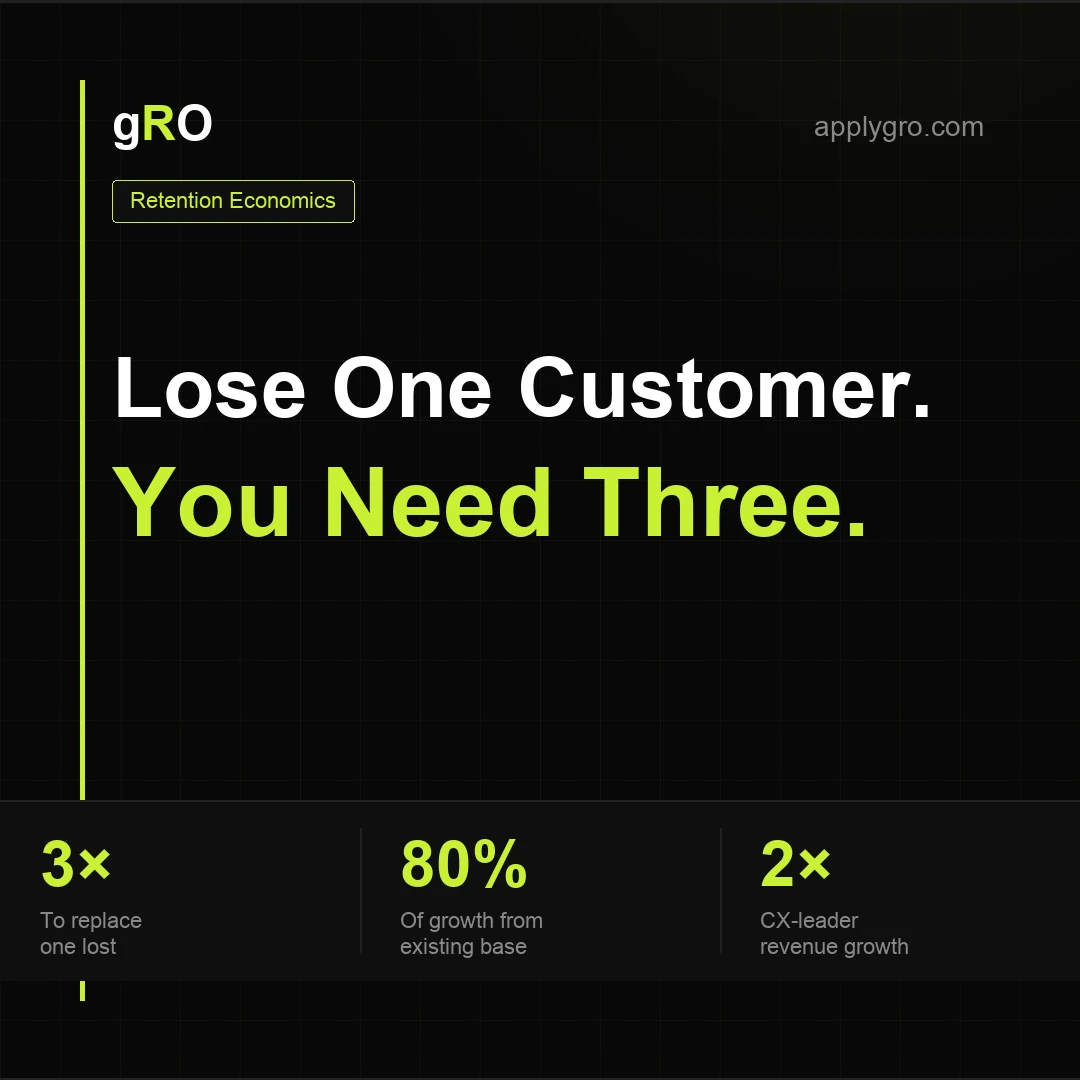
Retention Economics.
Replacing one churned customer can take three new ones, and 80% of the best companies' growth comes from existing customers (McKinsey). The retention math most $1M–$10M ARR founders ignore.
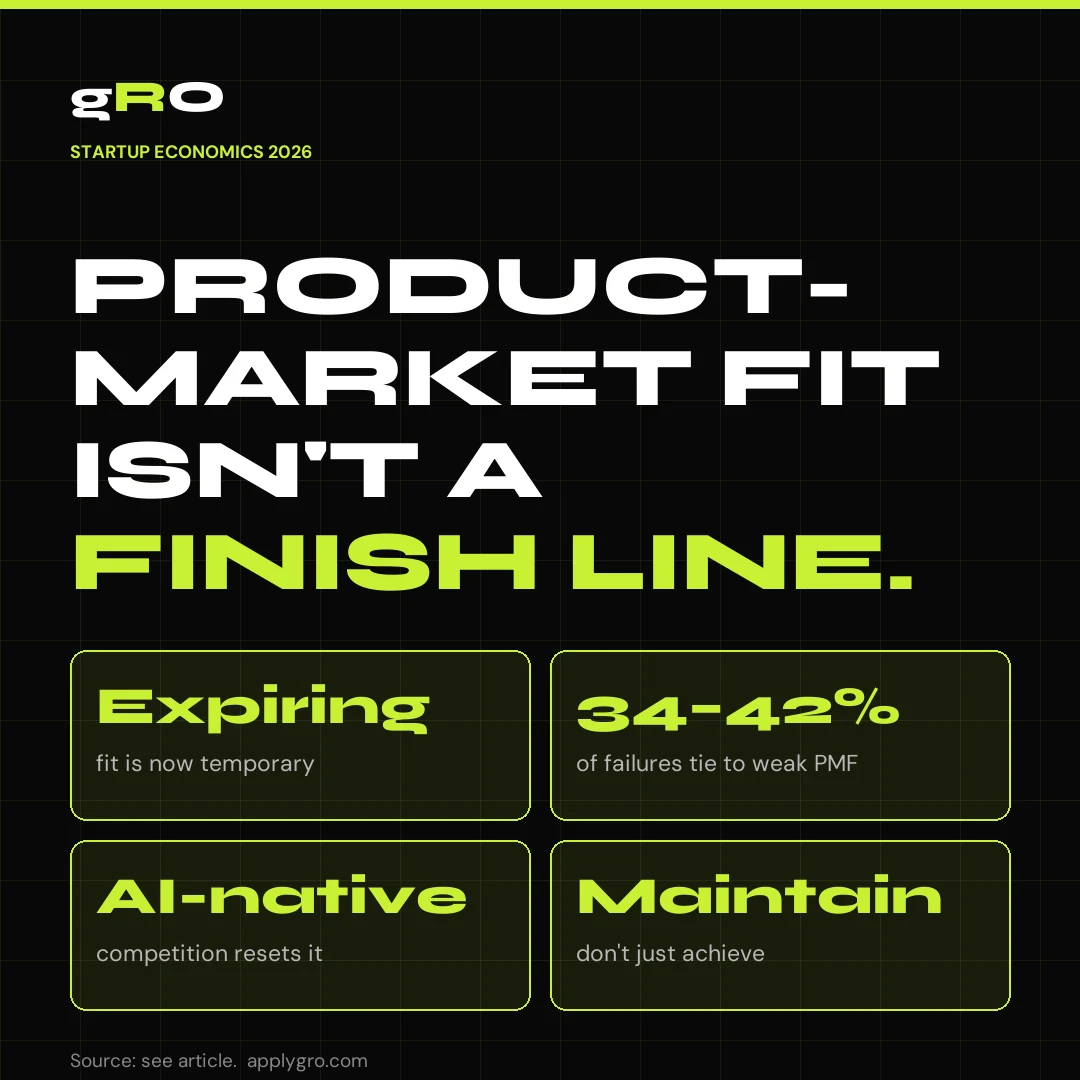
Product-Market Fit Isn't a Finish Line.
You were taught to find PMF once and protect it. In 2026 that model is breaking — fit is a temporary state that expires as AI-native competition resets positioning. Why PMF is now a maintained position, re-earned every quarter.
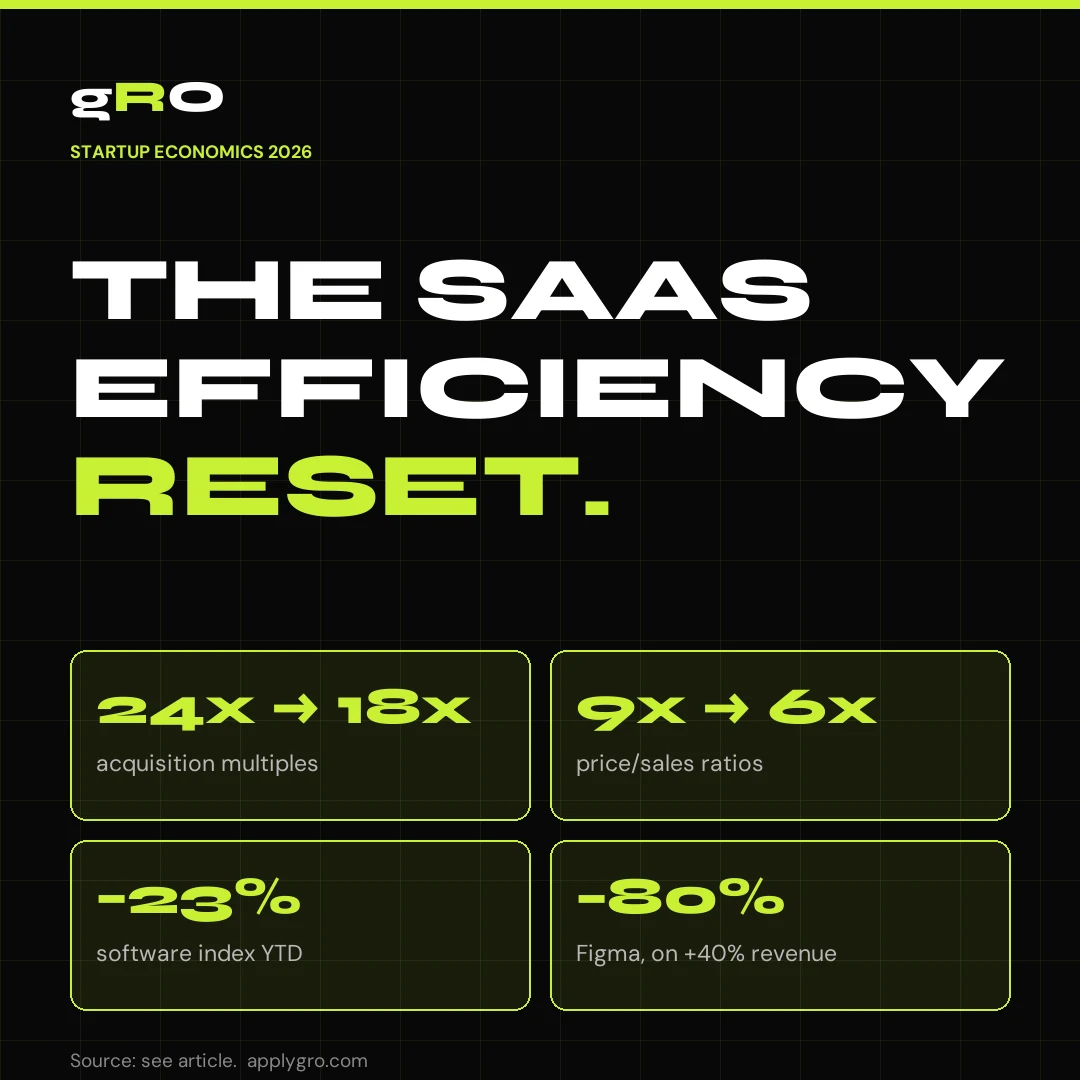
The SaaS Efficiency Reset.
SaaS multiples fell 24x→18x; price/sales compressed 9x→6x; Figma dropped 80% while growing revenue 40%. The market changed the question from how fast you grow to how efficiently. Where your next dollar compounds now.
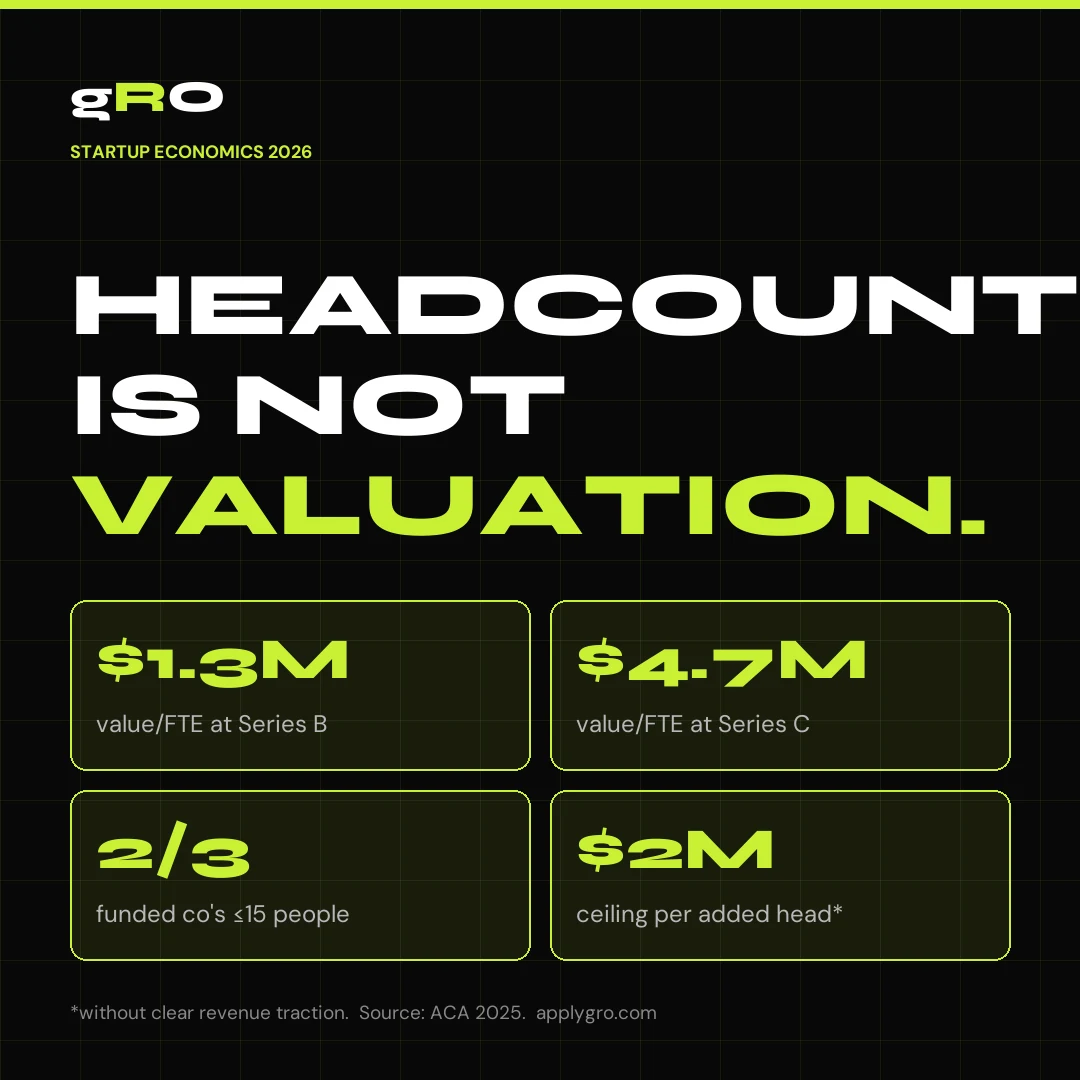
Headcount Is Not Valuation.
Angel investors funded ~1,000 startups in 2024. Valuation per employee is flat until Series C, dips at Series B as companies bulk up on go-to-market hires, and two-thirds of funded companies run on ≤15 people. The market prices output density, not headcount.
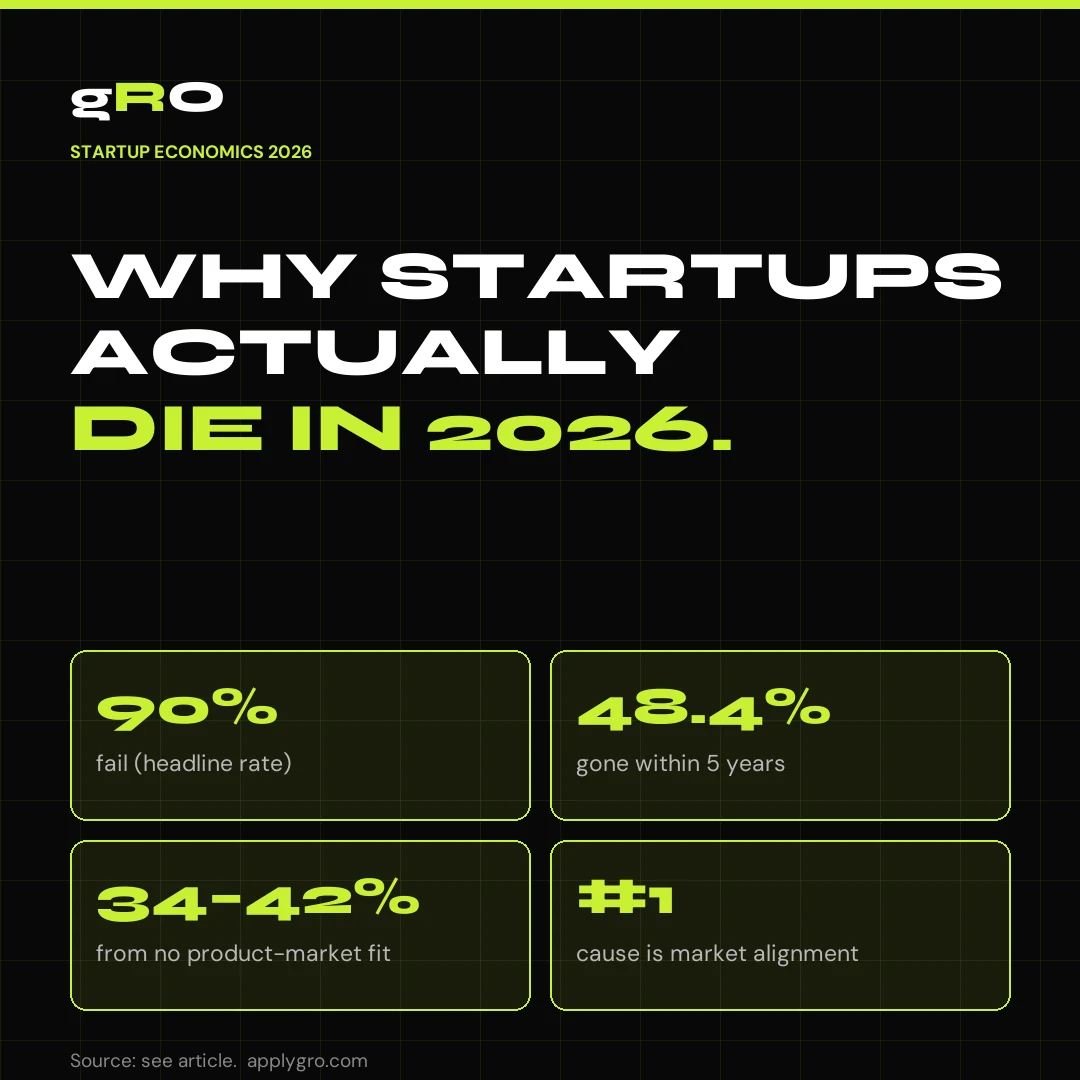
Why Startups Actually Die in 2026.
The autopsy almost never reads "couldn't build it." 90% fail; 48.4% within five years; no product-market fit is the #1 cause (34–42%). Startup death is a go-to-market problem wearing a product costume — and most of it is preventable.
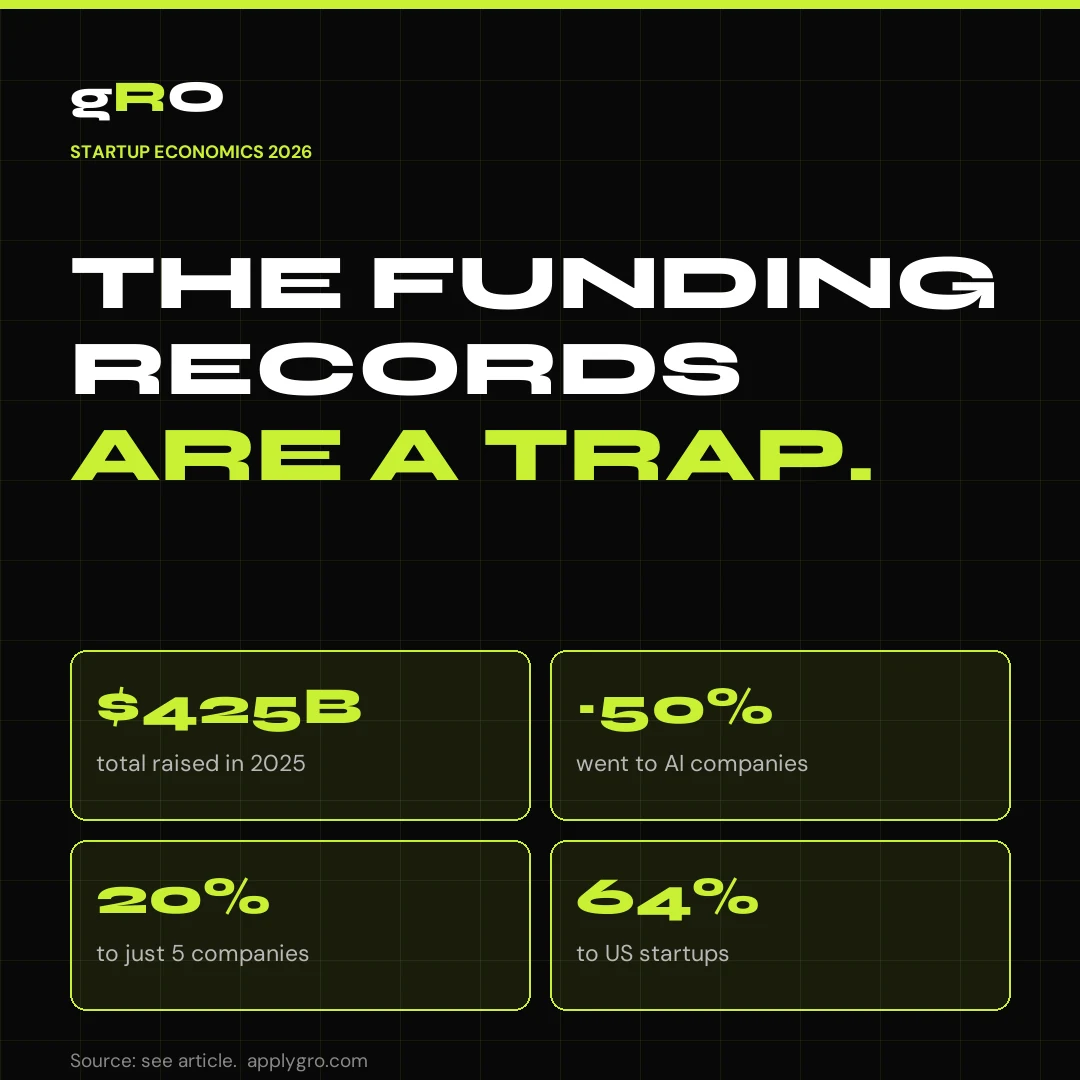
The Funding Records Are a Trap.
2025 set every venture record — $425B deployed, the largest round in history, ~50% to AI, 20% to five companies. For a $1M–$10M ARR founder not raising a $40B AI round, those records are a mirage. The market you actually operate in repriced down 24x→18x.
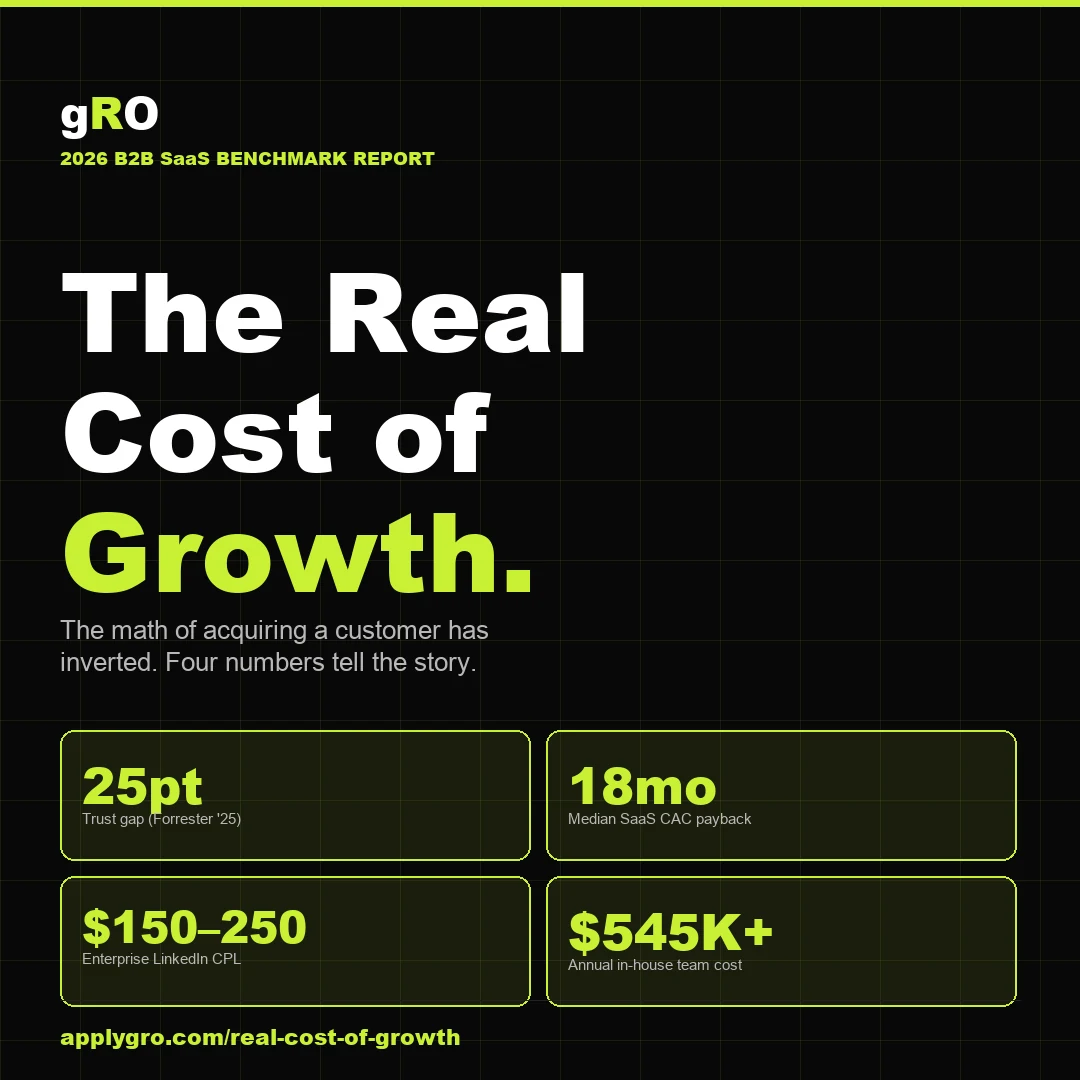
The Real Cost of Growth: Why $1M–$10M ARR Founders Are Paying More for Less.
A 2026 B2B SaaS benchmark report. Why the math of acquiring a customer has inverted — 25-pt trust gap, 18-mo CAC payback, $150–250 enterprise CPL, $408K+ in-house team cost — and the operator-led model rewriting it. Every benchmark independently sourced. Includes the free PDF.
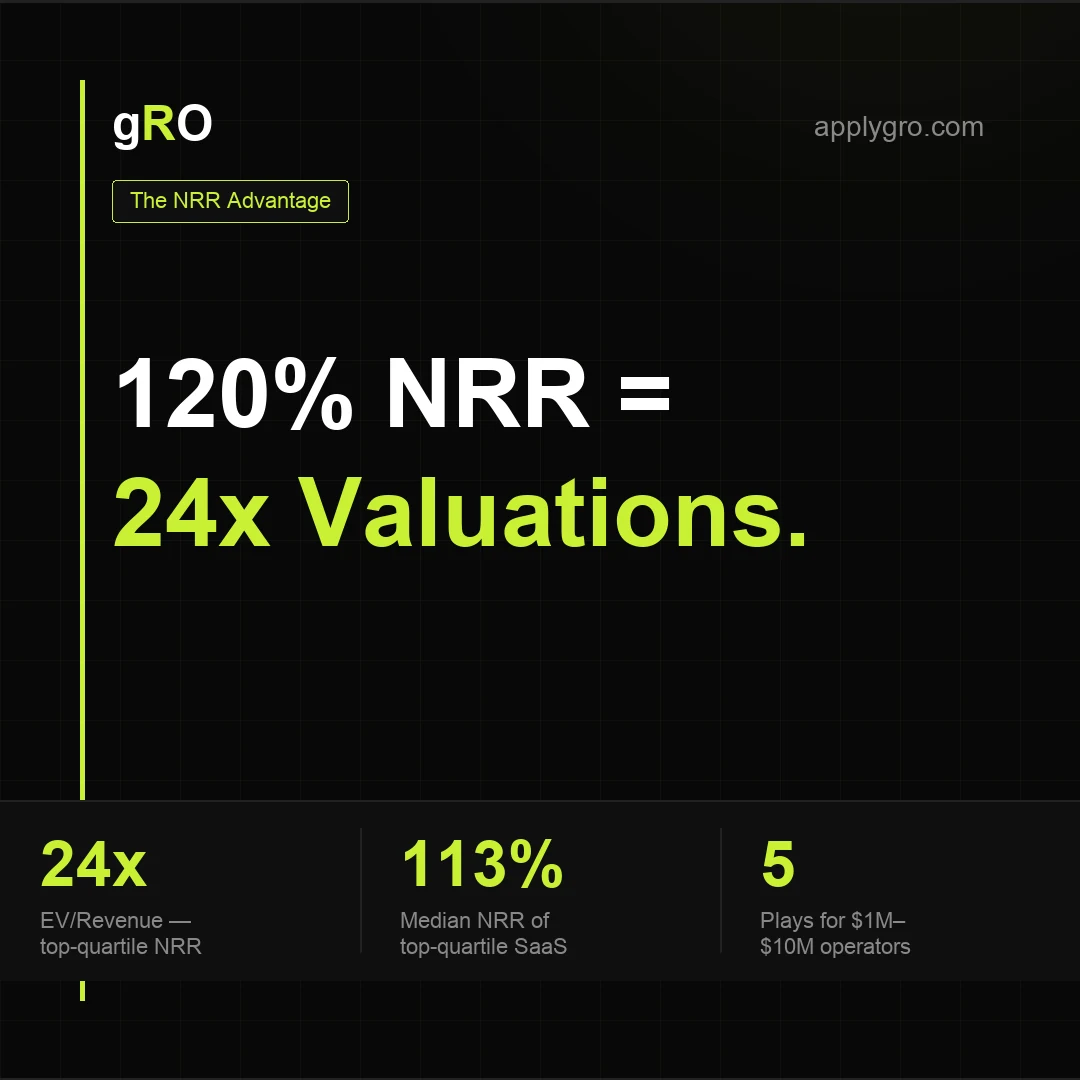
How 120% NRR SaaS Companies Get 24x Valuations.
McKinsey decoded for operators. Top-quartile NRR B2B SaaS trades at 24x revenue while bottom-quartile sits at 5x. The 9 practices, the 5 plays, and the operator playbook. Includes the 7-minute video.
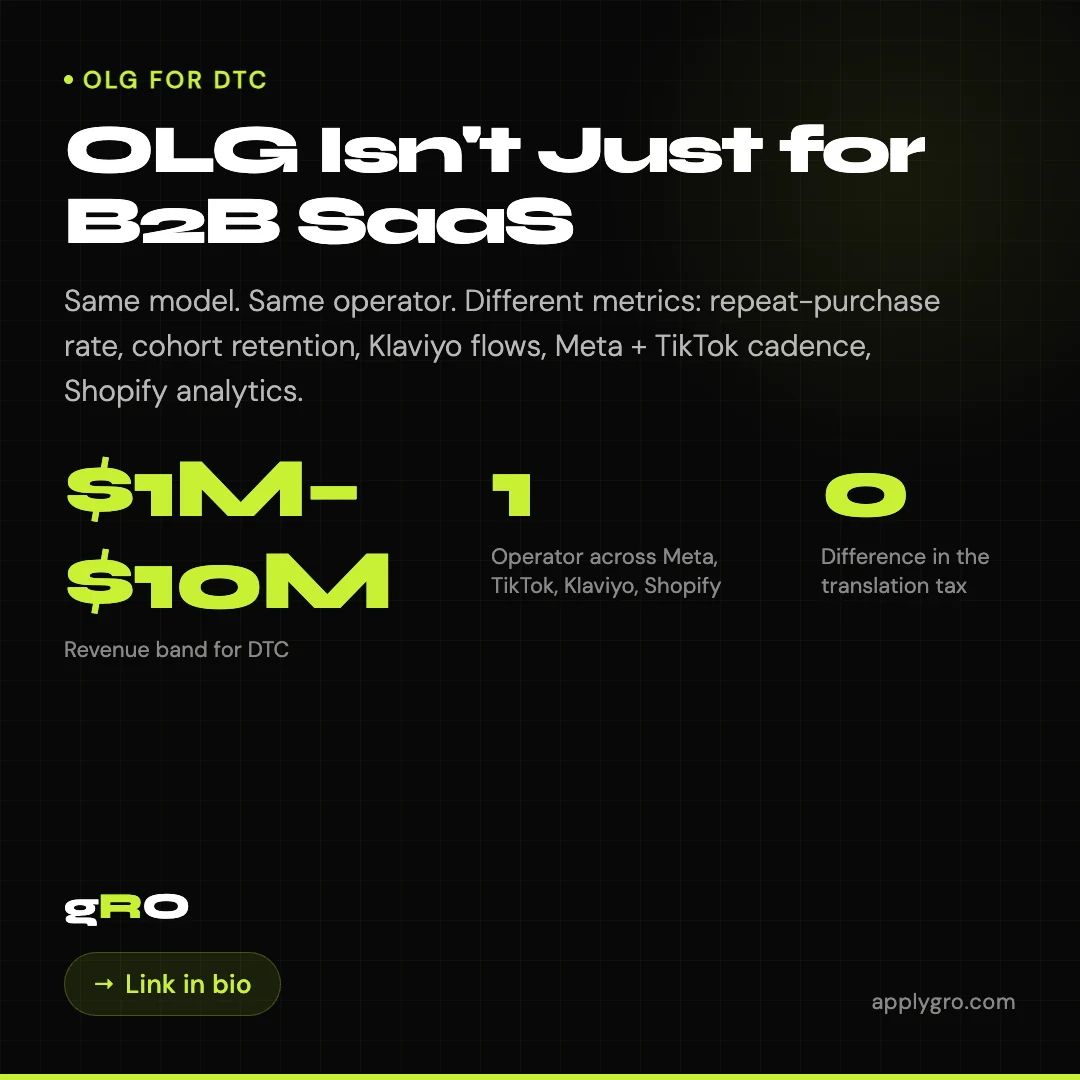
OLG Isn't Just for B2B SaaS.
Same model. Same operator. Different metrics: repeat-purchase rate, cohort retention, Klaviyo flows, Meta + TikTok cadence, Shopify analytics.
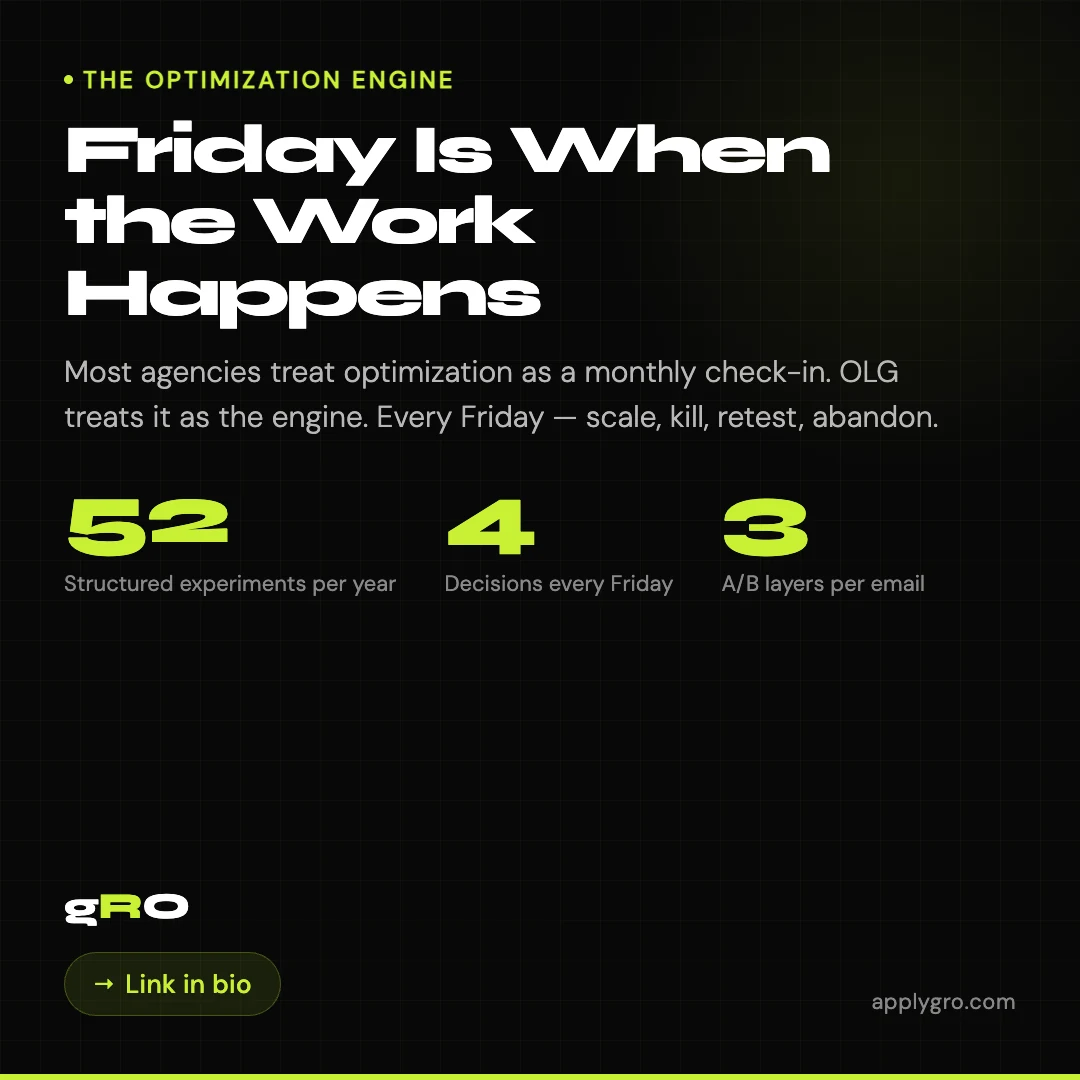
Friday Is When the Work Happens.
Most agencies treat optimization as a monthly check-in. Operator-Led Growth treats it as the engine. Every Friday — scale, kill, retest, abandon.

The Forecast Your CFO Actually Wants.
Most marketing forecasts are aspirations dressed up in math. A real forecast updates monthly, reconciles to variance, and survives a CFO's line-item review.

Your Dashboard Is Lying to You.
Most dashboards report platform-default attribution on six-month-old data. The fix isn't a six-week project — it's a Friday afternoon.

Operator-Led Growth — A New Model for B2B and B2C.
A new model for $1M–$10M founders. One senior operator owns strategy AND execution. An agent fleet handles production. Six standards define the model.
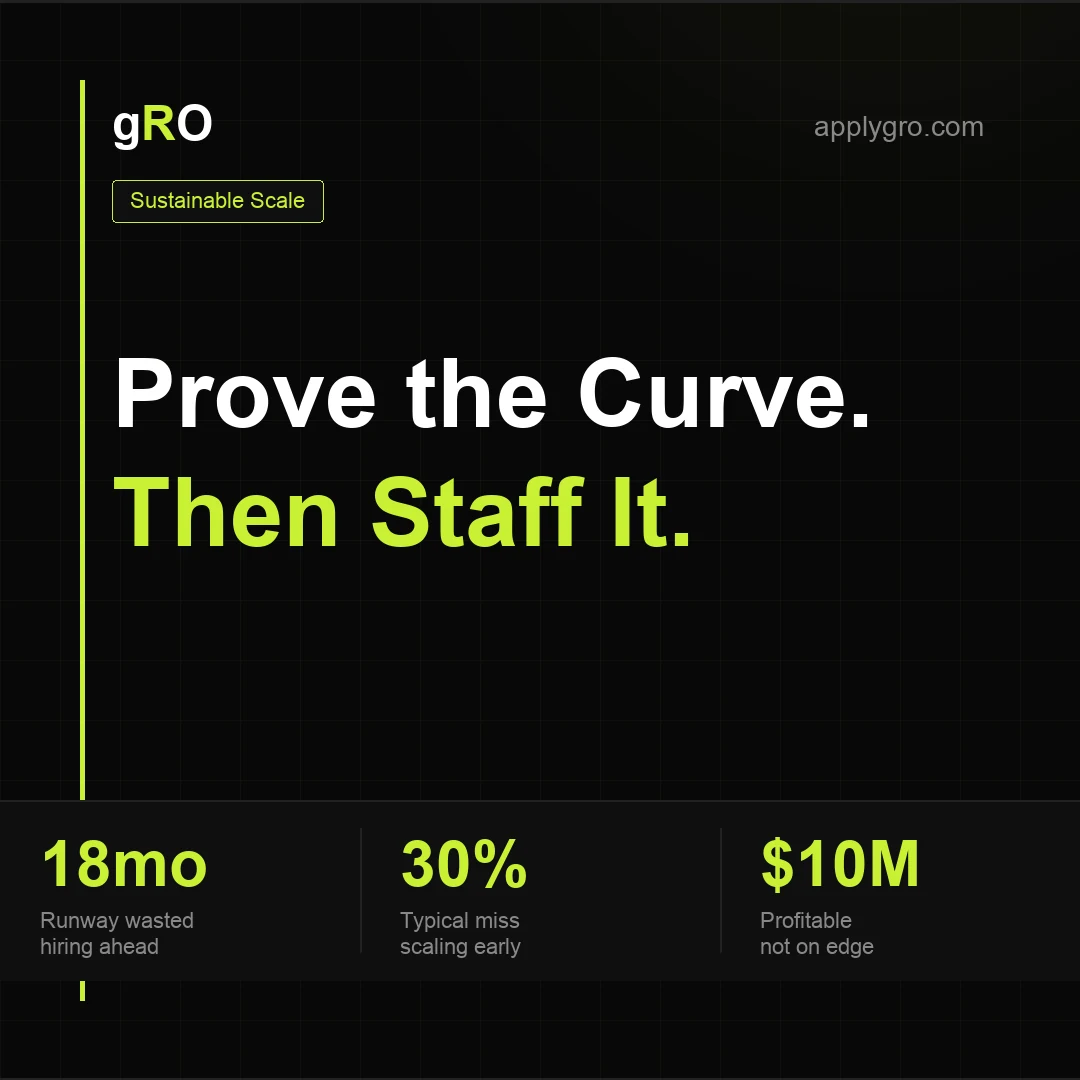
Prove the Curve. Then Staff It.
The fastest way to kill a $3M SaaS is hiring the $10M team before the revenue exists. Sustainable scale, explained.

One Blog Post. Ten Surfaces.
Why most B2B blog posts die in month three — and the repurposing workflow that turns every post into a distribution engine.
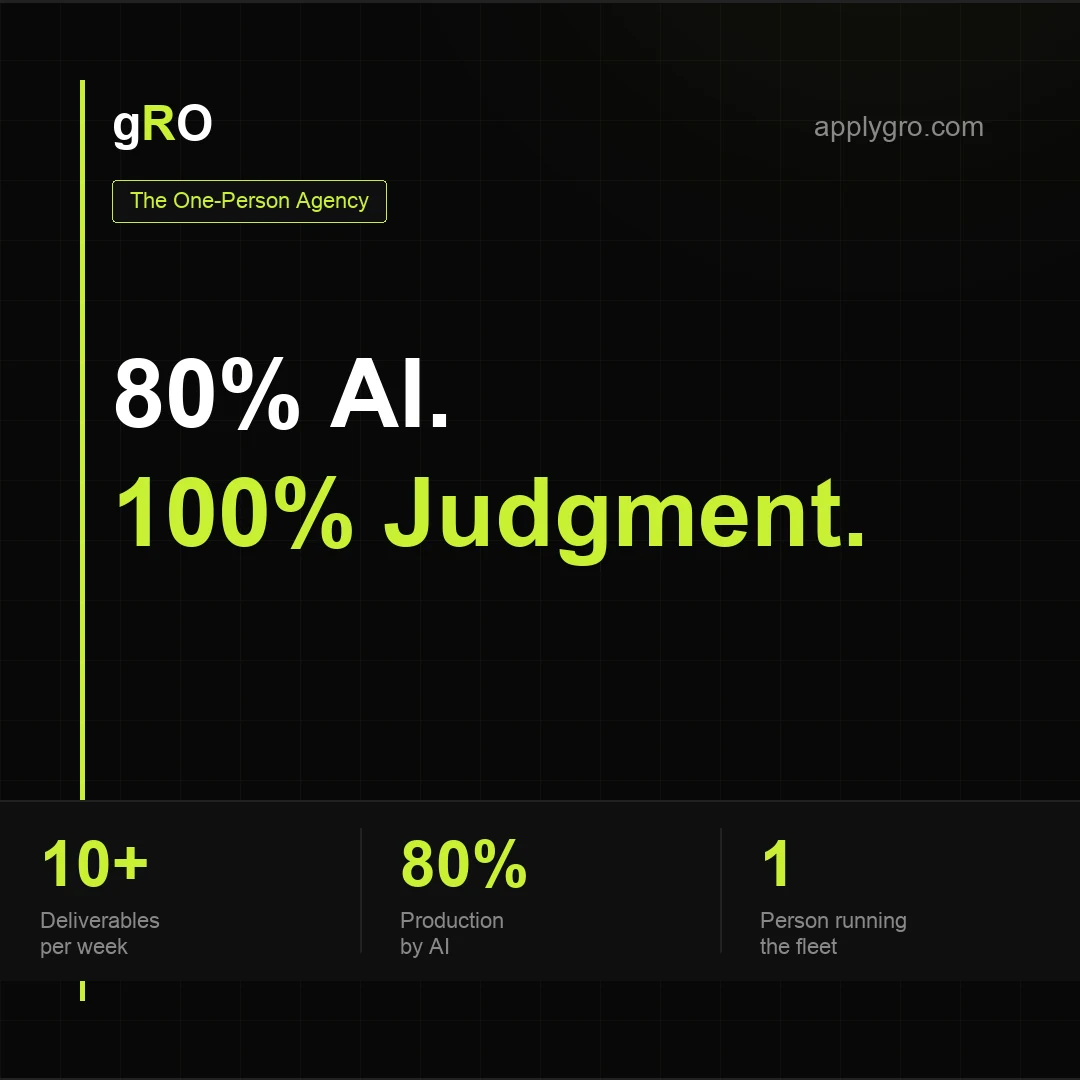
80% AI. 100% Judgment.
What one operator actually ships in a week when the workflow is built right. The stack, the prompts, the judgment calls.
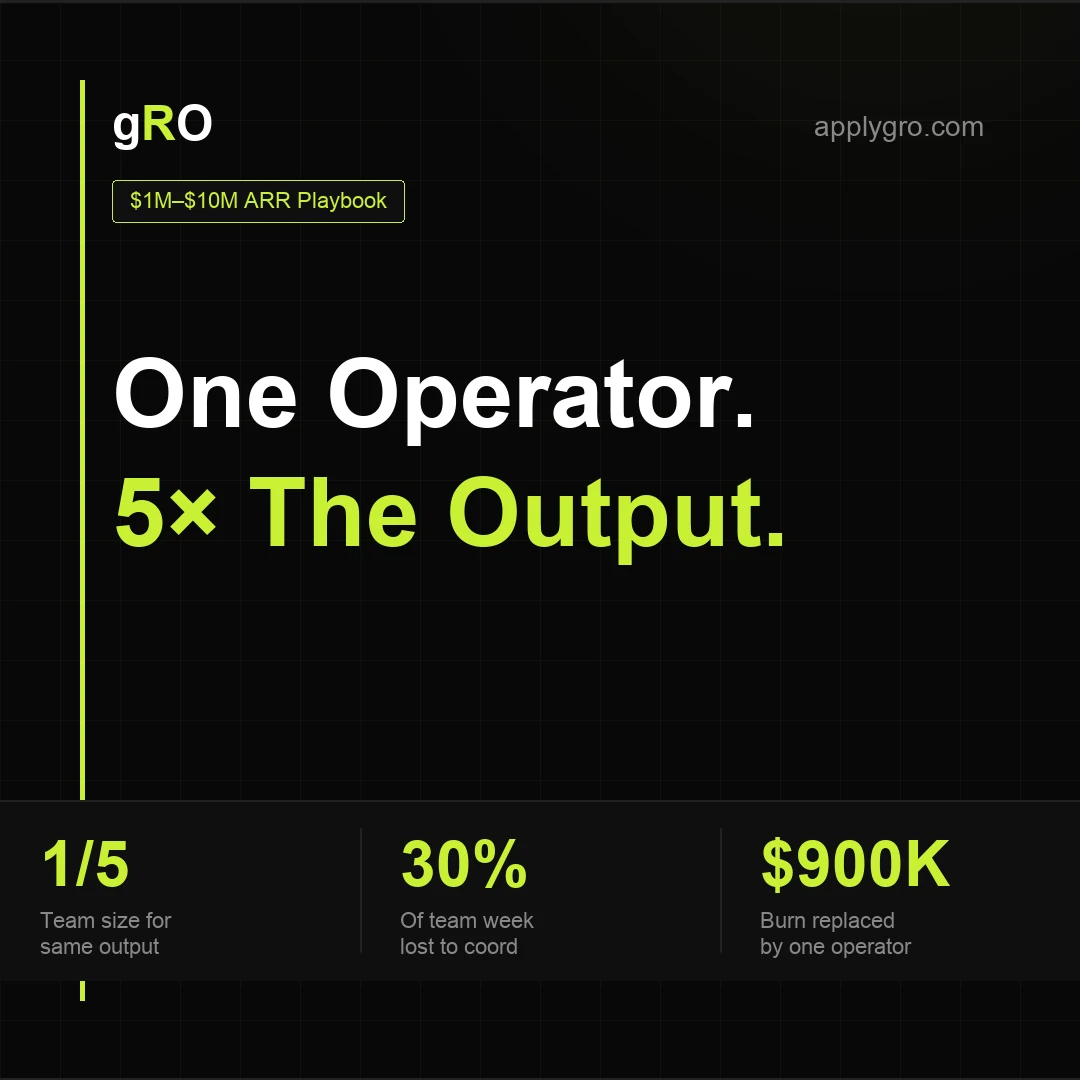
One Operator. Five Marketers of Output.
The $1M–$10M ARR growth manual — same output as a 5-person team without the $900K burn or coordination tax.
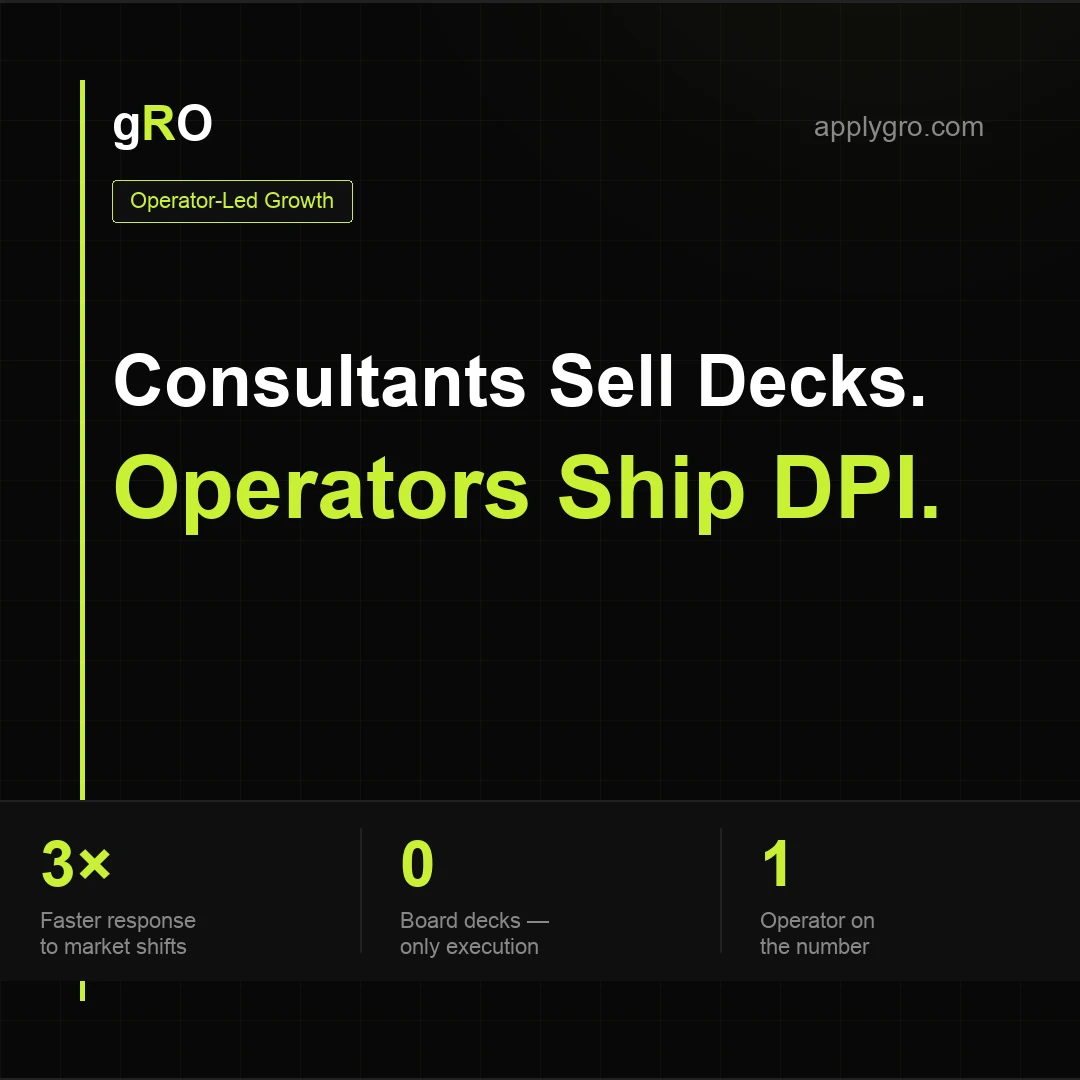
Consultants Sell Decks. Operators Ship DPI.
Why the pretty strategy deck breaks on contact with a hiring freeze, a budget cut, and a CAC spike — and what replaces it.
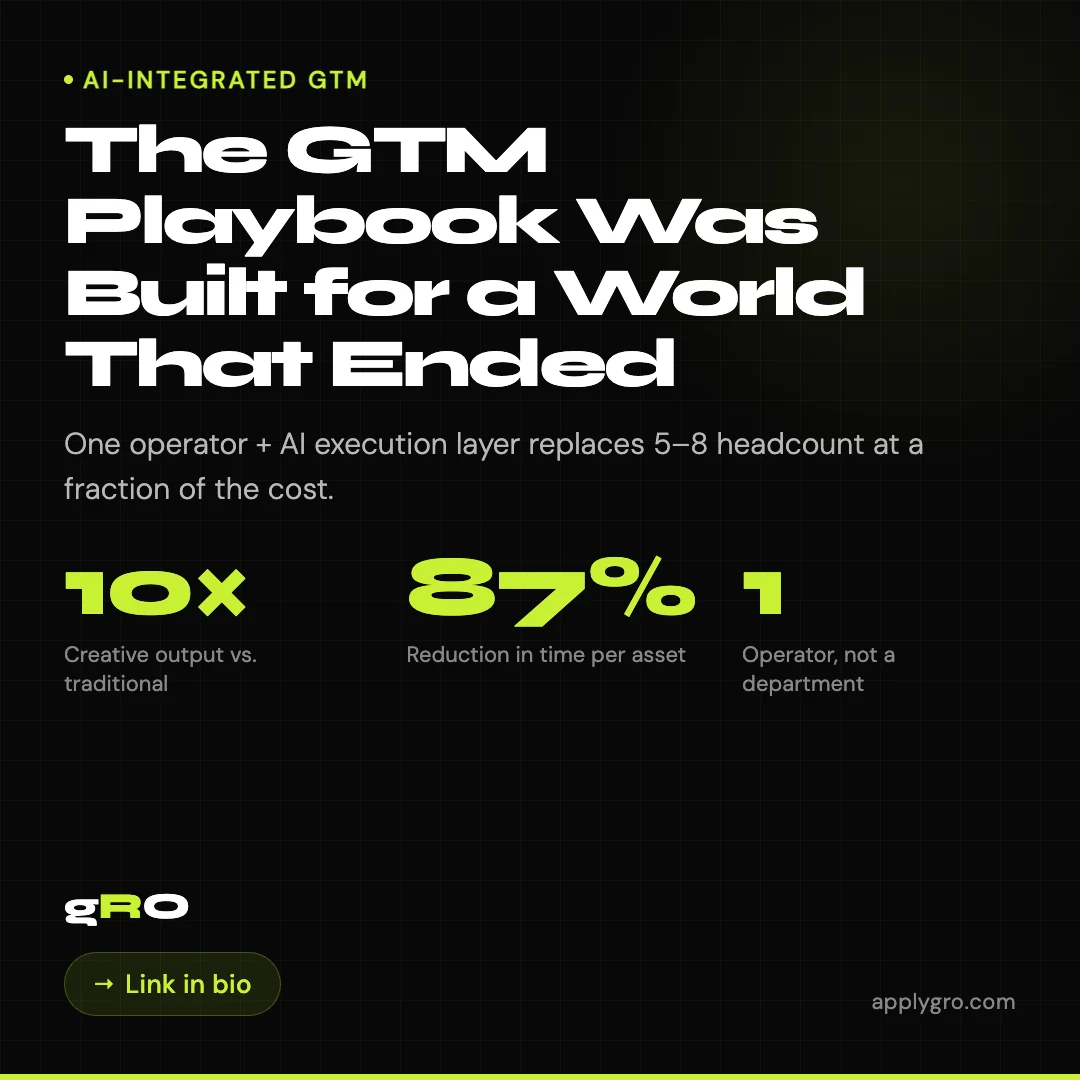
The GTM Playbook Was Built for a World That Ended.
The AI-integrated GTM engine for FinTech — running 24/7 at near-zero marginal cost, with one operator directing the fleet.
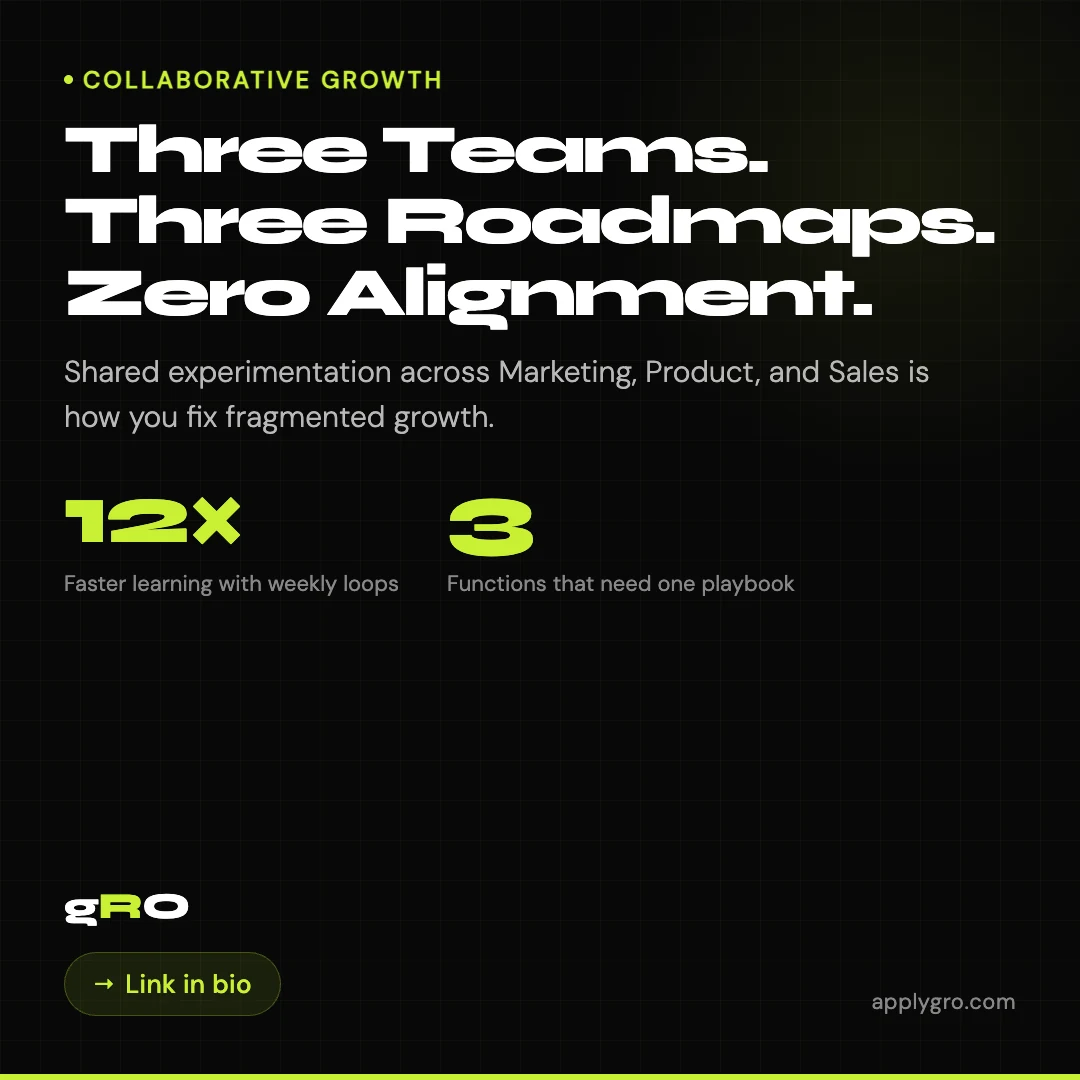
Three Teams. Three Roadmaps. Zero Alignment.
Marketing, Product, and Sales running from different playbooks is the default at $1–10M ARR. Shared experimentation is the fix.
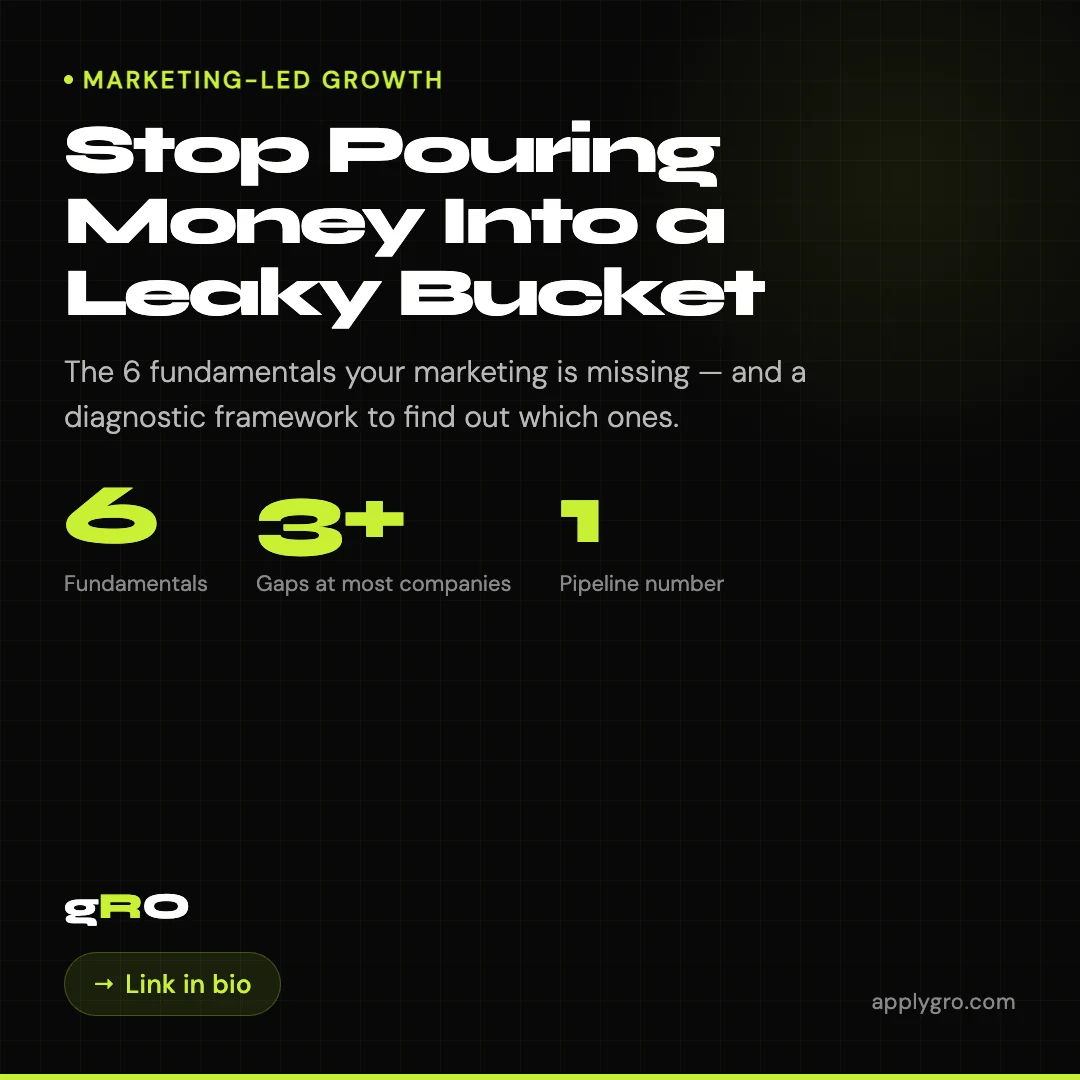
Stop Pouring Money Into a Leaky Bucket.
Rising CPL? Stalling pipeline? The campaigns aren't broken — the foundation is. The six fundamentals missing underneath them.

Your Best Prospects Are Already Your Customers.
Why 80% of B2B FinTech marketing budget goes to acquisition — and what doubles when you flip it.

13% of Buyers Are Loyal. The Rest Are Shopping.
87% of B2B buyers are evaluating alternatives right now. Being in the first mental shortlist makes you 2× more likely to win.
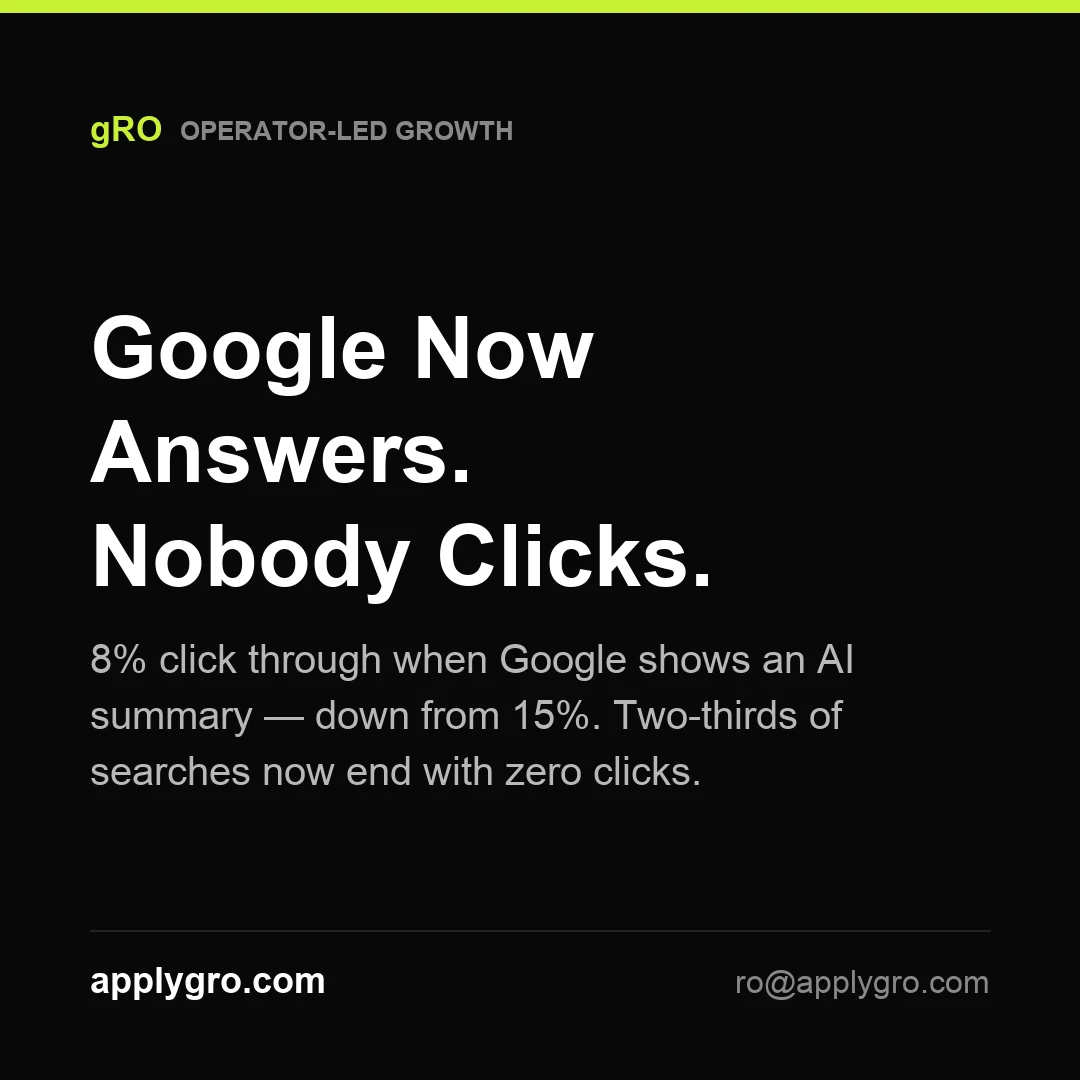
Google Now Answers. Nobody Clicks.
When Google shows an AI summary, searchers click through on just 8% of visits vs 15% without — and ~68% of searches now end with zero clicks. What AI search does to B2B demand gen.
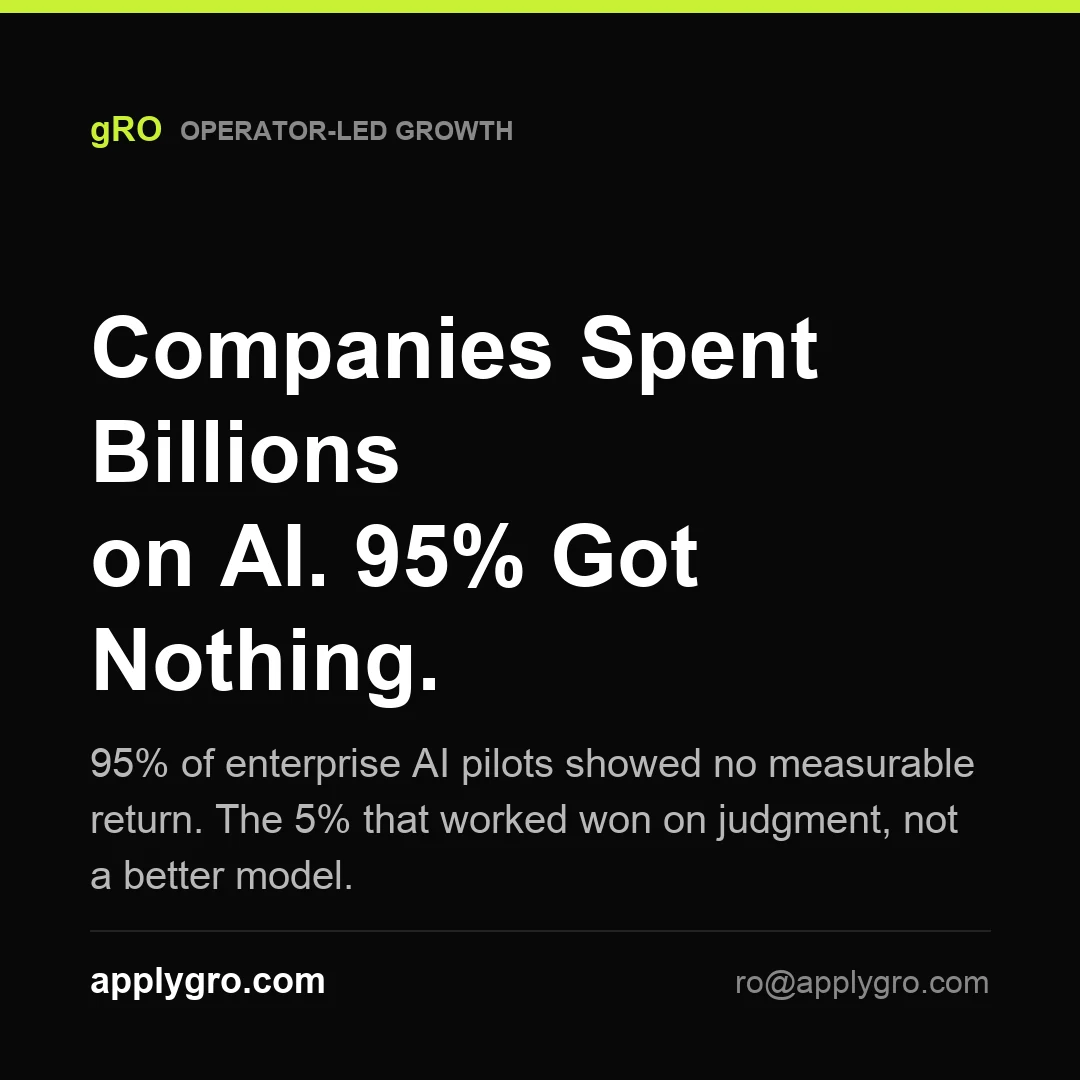
Companies Spent Billions on AI. 95% Got Nothing Back.
MIT found 95% of enterprise generative-AI pilots produced no measurable return; only ~5% captured real value. The difference wasn't the model — it was judgment and process.

The Market Stopped Pricing Your Headcount.
Top-quartile B2B SaaS runs ~$279K ARR per employee vs a ~$141K median, and the median jumped ~29% in a year. Output density, not headcount, now sets your valuation.
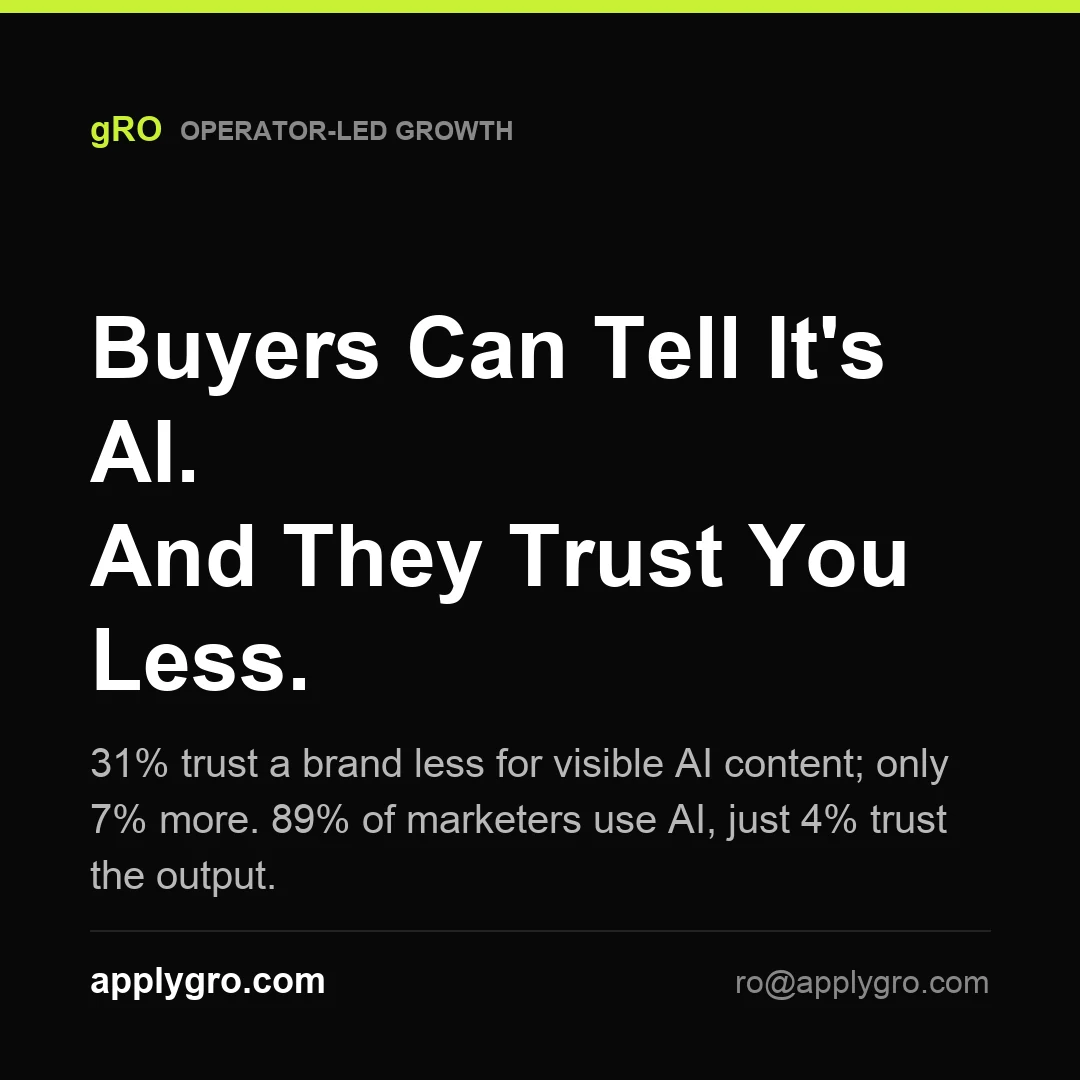
Buyers Can Tell It's AI. And They Trust You Less.
31% of buyers trust a brand less when they notice AI content; only 7% trust it more. 89% of marketers use AI, just 4% trust the output. Why judgment beats volume.
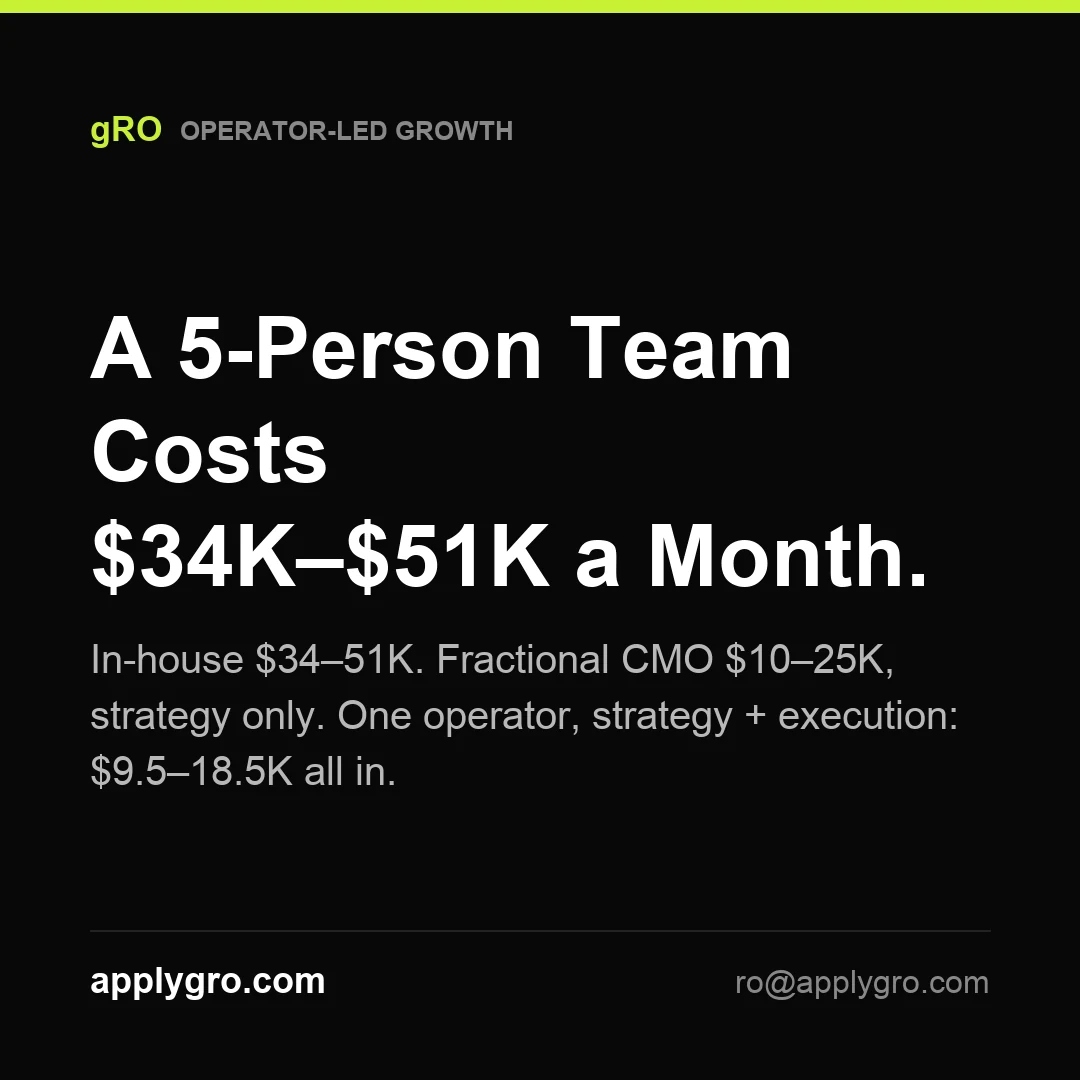
A 5-Person Marketing Team Costs $34K–$51K a Month.
In-house team: $34–51K/mo. Fractional CMO: $10–25K/mo for strategy only. One senior operator, strategy and execution: $9,500–$18,500 all in — published price. The real cost comparison.
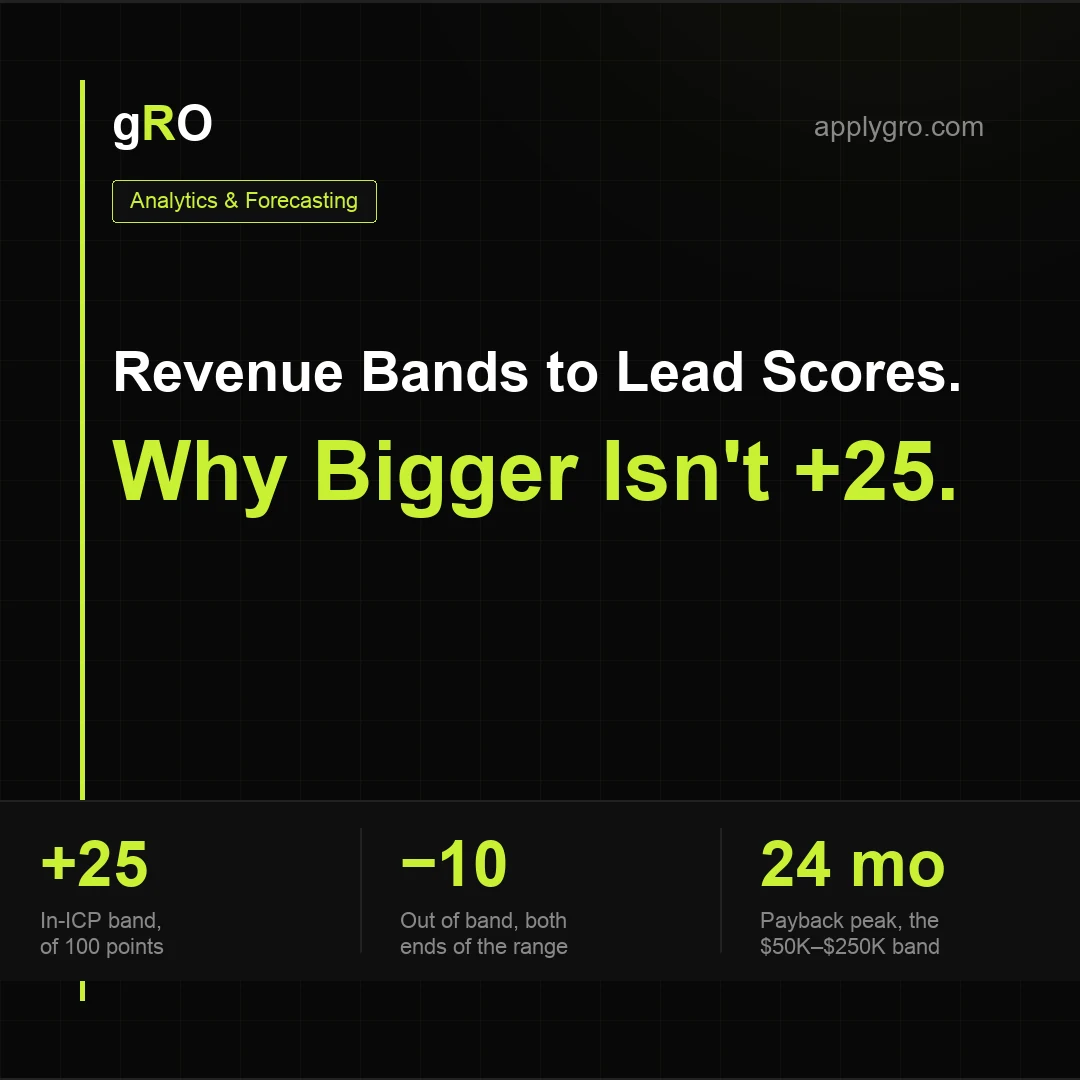
Revenue Bands to Lead Scores: The 25 / 10 / −10 / 0 Rubric.
In-ICP revenue band: +25. Adjacent: +10. Out-of-band: −10. Unknown: 0, never negative. The four-number firmographic rubric, how a nine-band vendor ladder from $0–1M to $200M+ collapses into it with first-match rules (SQL, JavaScript, Sheets), a scorer for your own bands, and a free 22-page field guide.
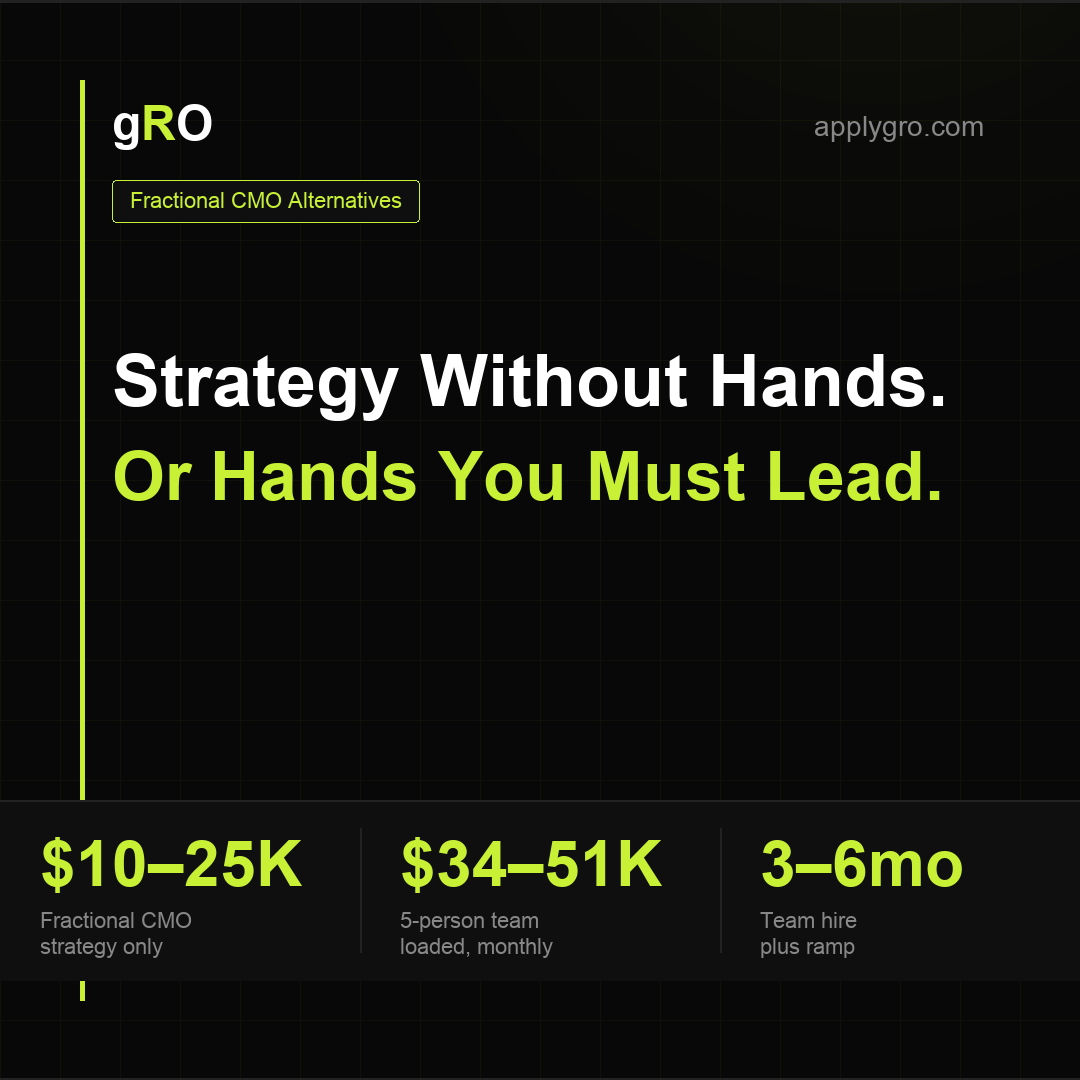
Fractional CMO vs In-House Team: The Honest Comparison.
A fractional CMO ($10–25K/mo) buys strategy without hands. An in-house team ($34–51K/mo loaded) buys hands you still have to lead. The cost table, the ramp reality, and the trap in choosing between them.
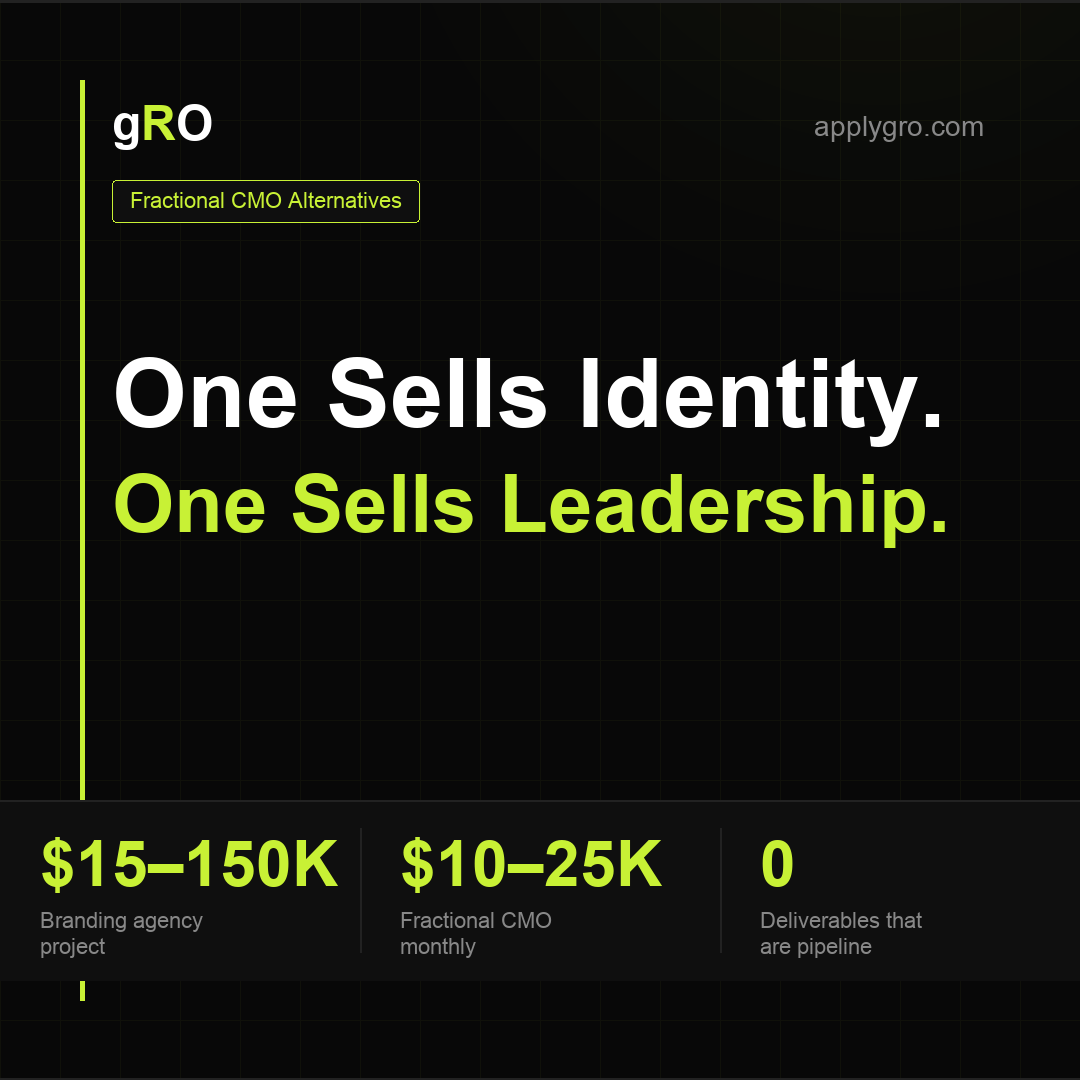
Fractional CMO vs Branding Agency: Two Different Jobs.
One sells identity ($15K–$150K per project). One sells leadership ($10–25K/mo). Neither sells pipeline. How to tell a brand problem from a funnel problem — before spending an order of magnitude on the wrong fix.
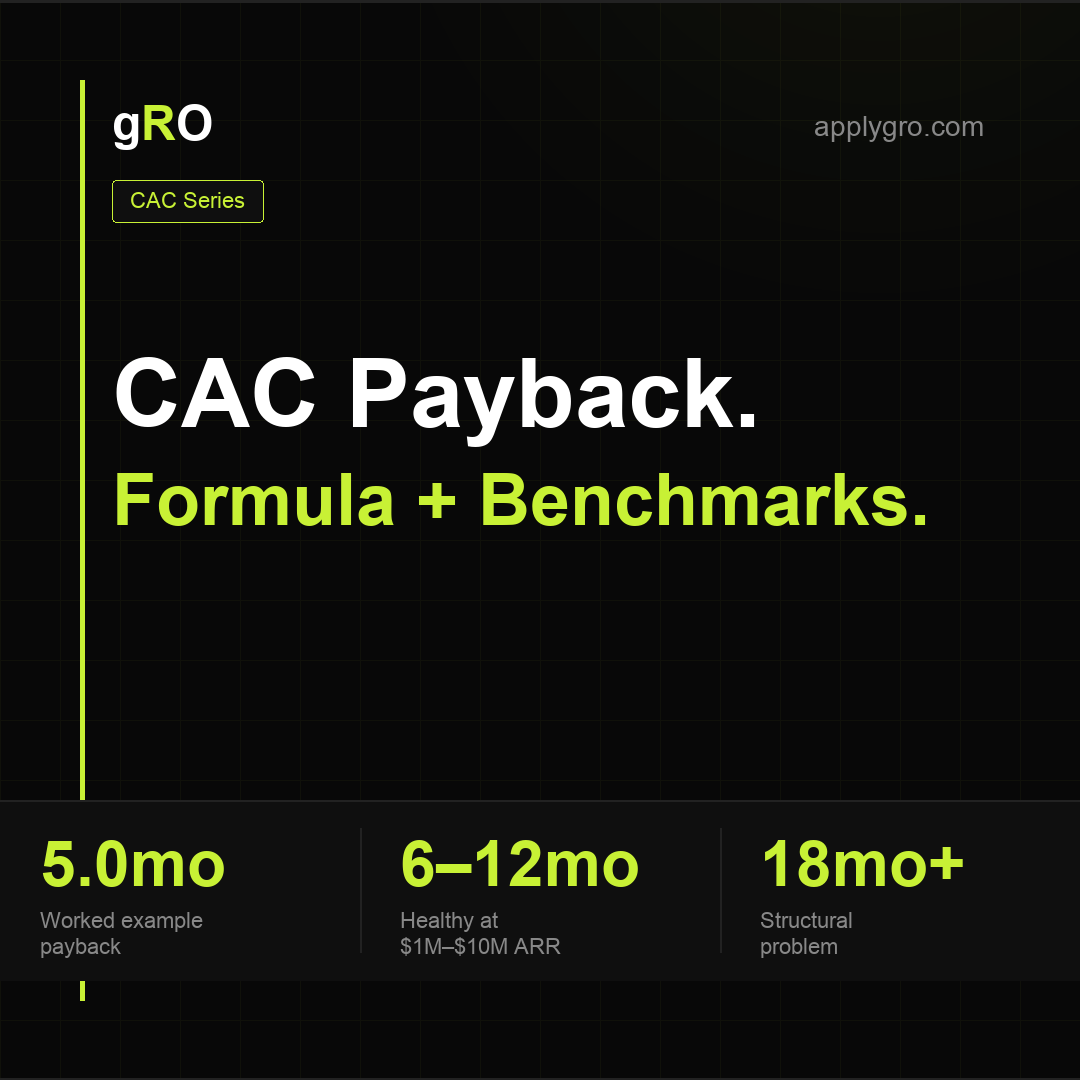
SaaS CAC Payback Period: Formula & Benchmarks by Stage.
CAC ÷ monthly gross profit per customer = payback in months. A worked example at $4M ARR, healthy ranges by ARR stage, and the three structural drivers — ACV, CAC, gross margin — that actually compress it.