Marketing Analytics & Forecasting for B2B SaaS
Most marketing dashboards at $1M–$10M ARR run on platform-default attribution and six-month-old data. Most marketing forecasts are aspirations dressed up in math — built once a year, never reconciled against actuals. That's the gap this section closes. Operator-grade analytics means knowing which channel drove pipeline this week, not which channel got credited by last-click. Operator-grade forecasting means a model your CFO can defend line-by-line, updated monthly, reconciled to variance. The discipline isn't a six-week BI project — it's a Friday afternoon decision framework. Start with the forecasting article if your board questions assumptions, or the analytics article if your team is making decisions on stale numbers.
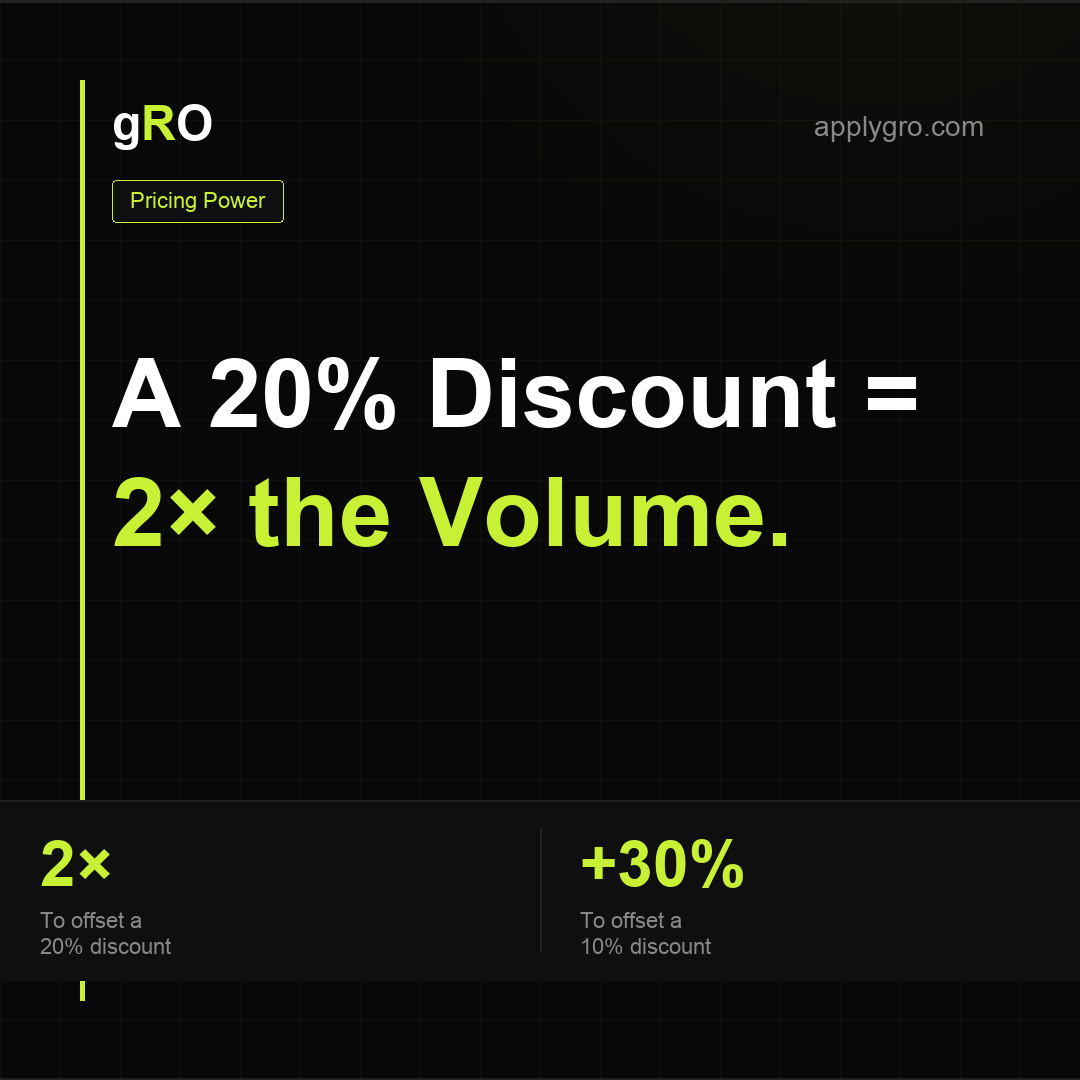
A 20% Discount Means Selling Twice as Much.
At a 50% gross margin, a 20% discount forces you to double unit volume just to break even on profit — and every discount trains buyers to wait. The contribution-margin math.
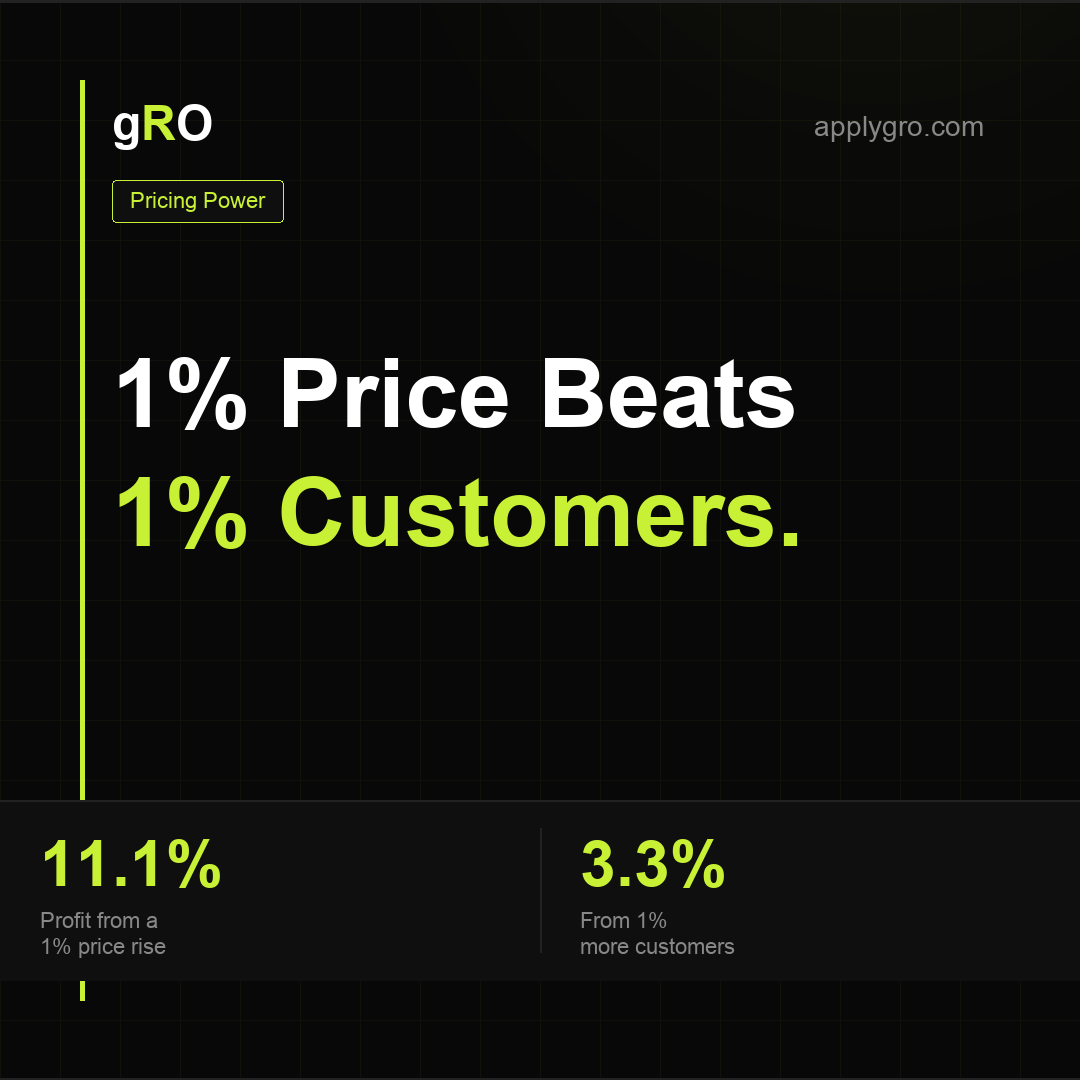
A 1% Price Increase Beats 1% More Customers.
The classic McKinsey finding: a 1% price increase raises operating profit 11.1%, vs ~3.3% from a 1% gain in customers. Why founders under-use the most powerful lever they have.
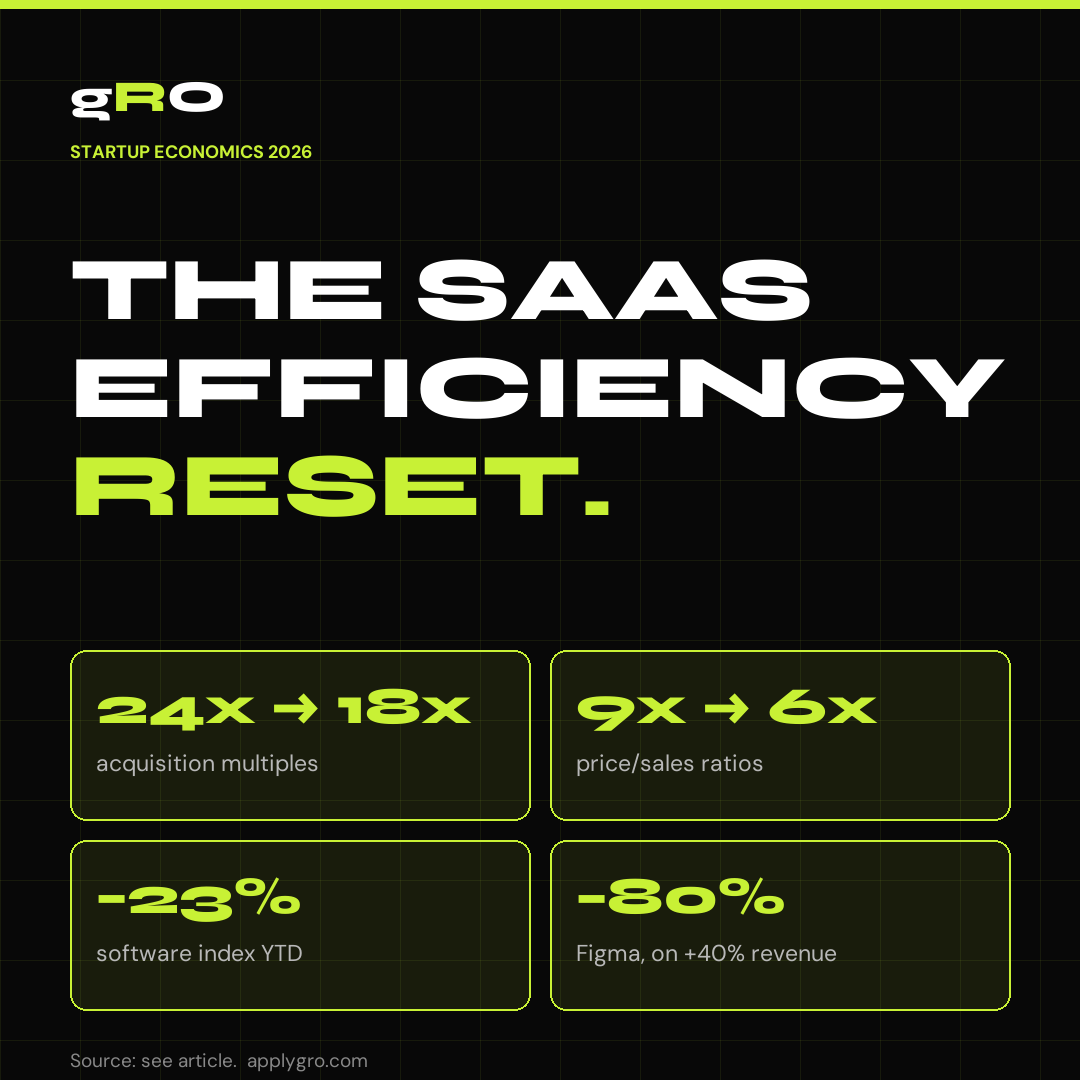
The SaaS Efficiency Reset.
SaaS multiples fell 24x→18x; price/sales compressed 9x→6x; Figma dropped 80% while growing revenue 40%. The market changed the question from how fast you grow to how efficiently. Where your next dollar compounds now.

The Real Cost of Growth: Why $1M–$10M ARR Founders Are Paying More for Less.
A 2026 B2B SaaS benchmark report. Why the math of acquiring a customer has inverted — 25-pt trust gap, 18-mo CAC payback, $150–250 enterprise CPL, $545K+ in-house team cost — and the operator-led model rewriting it. Every benchmark independently sourced. Includes the free PDF.

How 120% NRR SaaS Companies Get 24x Valuations.
McKinsey decoded for operators. Top-quartile NRR B2B SaaS trades at 24x revenue while bottom-quartile sits at 5x. The 9 practices, the 5 plays, and the operator playbook. Includes the 7-minute video.
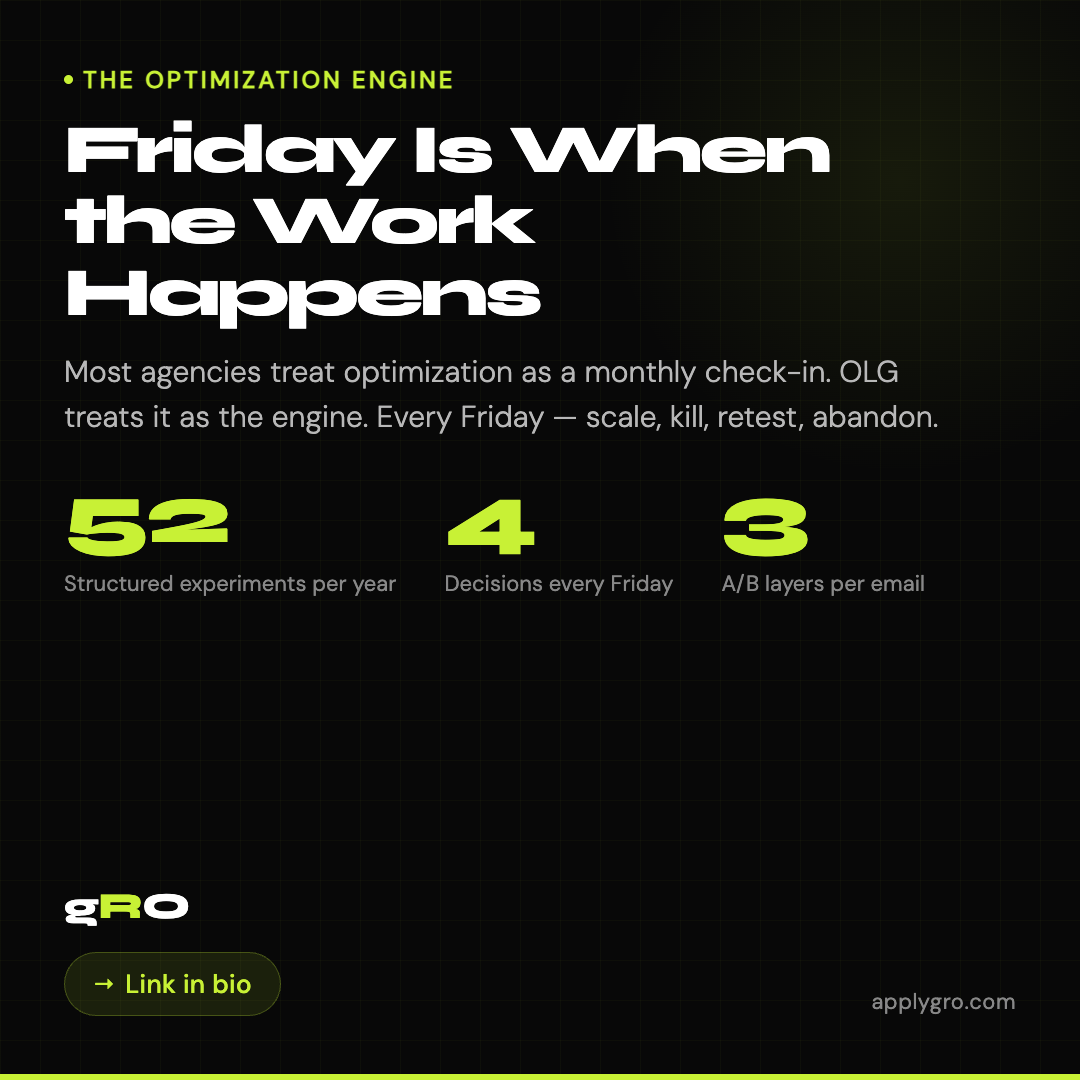
Friday Is When the Work Happens.
Most agencies treat optimization as a monthly check-in. Operator-Led Growth treats it as the engine. Every Friday — scale, kill, retest, abandon.

The Forecast Your CFO Actually Wants.
Most marketing forecasts are aspirations dressed up in math. A real forecast updates monthly, reconciles to variance, and survives a CFO's line-item review.
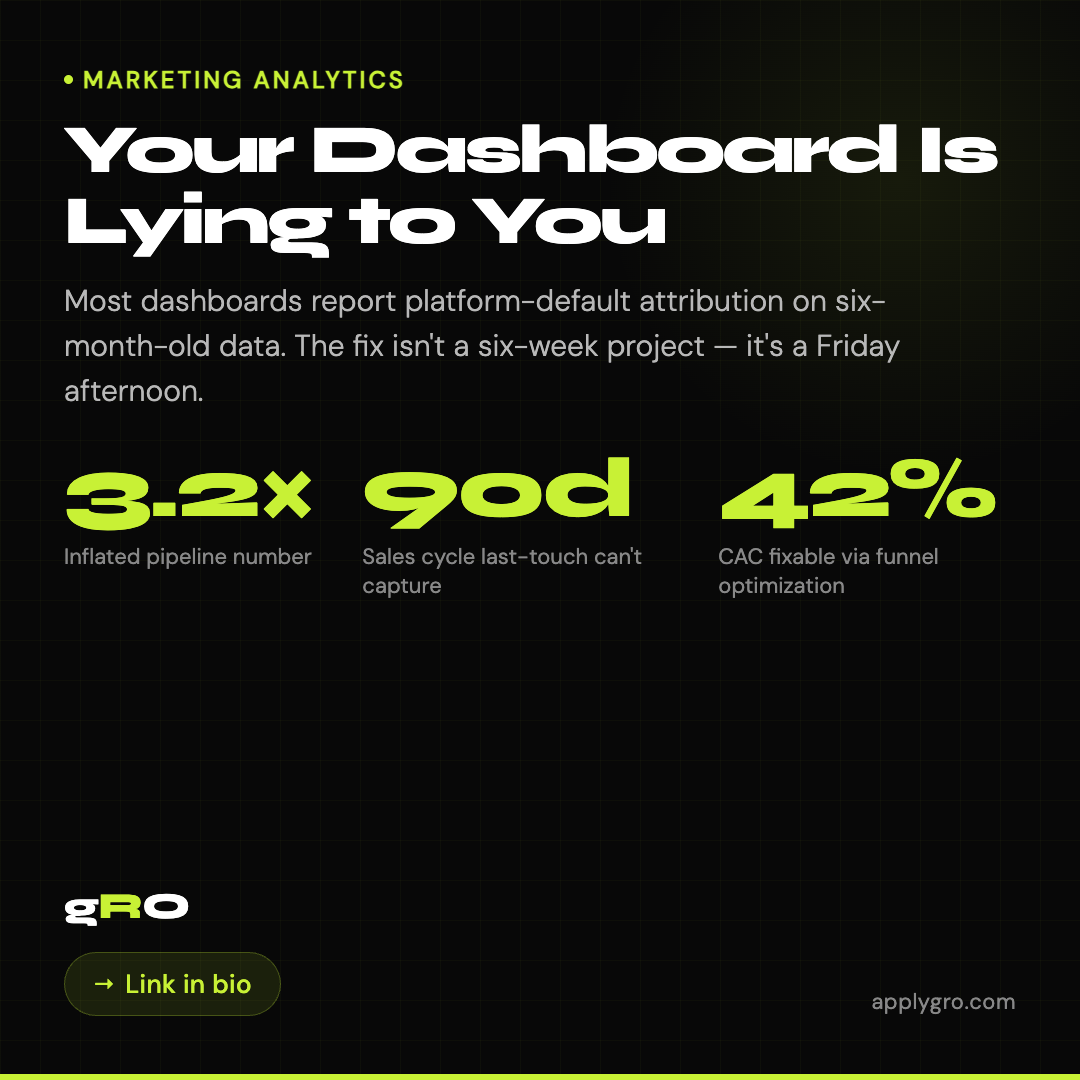
Your Dashboard Is Lying to You.
Most dashboards report platform-default attribution on six-month-old data. The fix isn't a six-week project — it's a Friday afternoon.