Pipeline is soft. The board wants a plan. So you write a hiring plan — a Head of Growth, a paid-media specialist, a lifecycle marketer, a copywriter, an analyst to tell you whether any of it worked. It feels like progress because it looks like progress. But \"hire the growth team\" is a bet that the constraint on your growth is capacity. For most B2B SaaS companies between $1M and $10M ARR, the constraint isn't capacity — it's judgment. And there's a quieter cost almost nobody prices in: what those hires do to your valuation.
Valuation per employee is flat until Series C
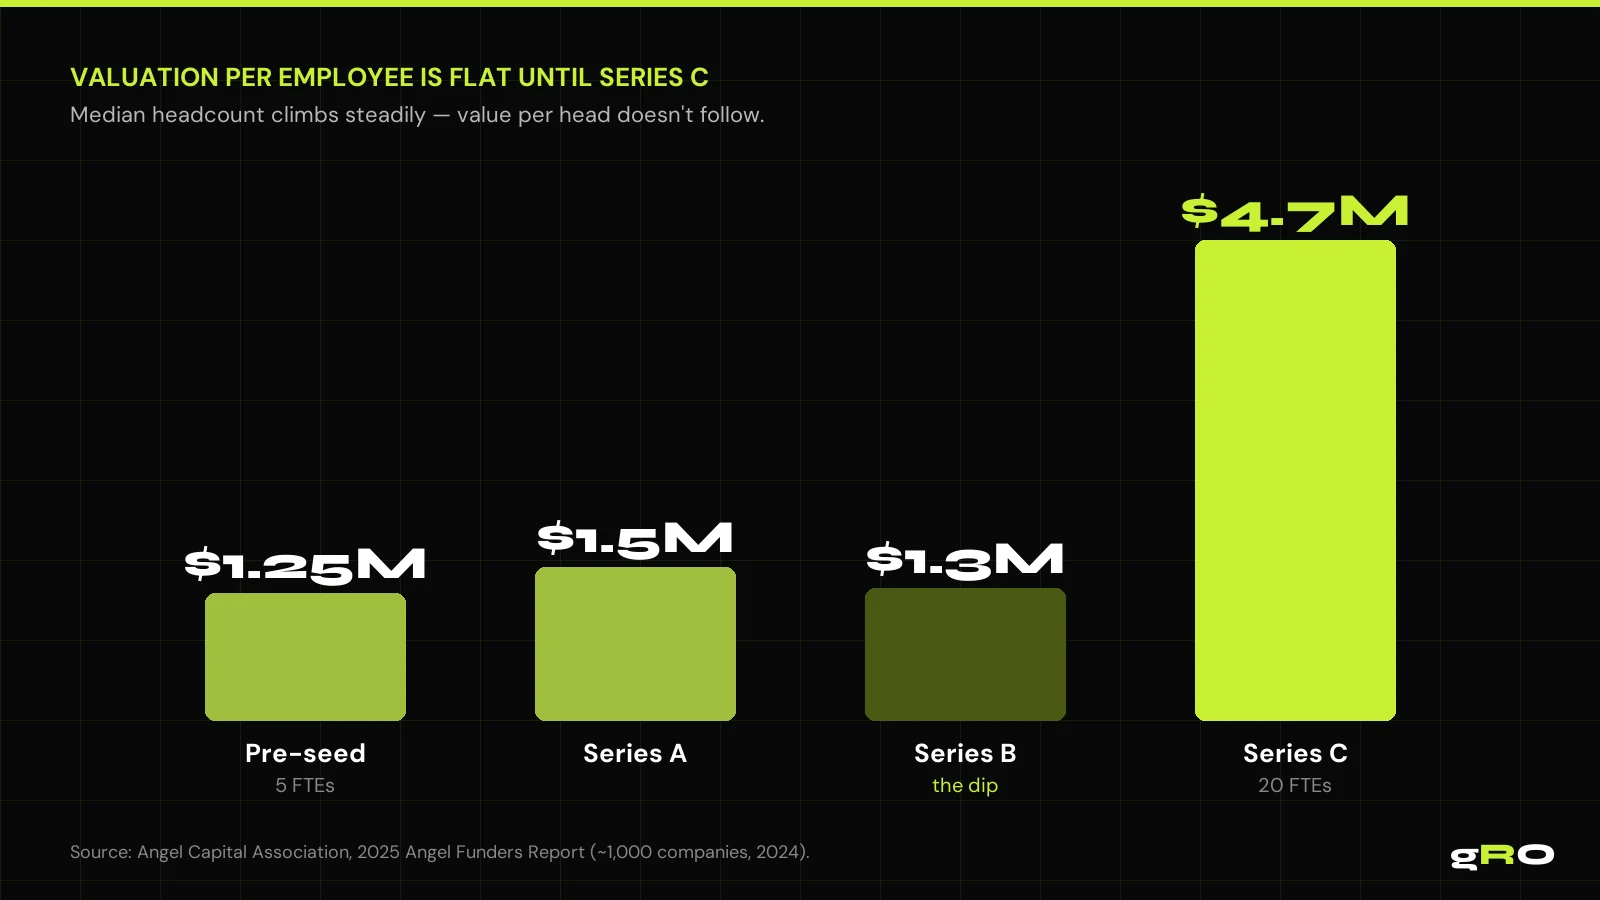
In 2025, the Angel Capital Association analyzed investments across roughly 1,000 companies funded in 2024. Median headcount rises in orderly steps — from about 5 FTEs at pre-seed to 20 by Series C. But valuation per employee does not climb alongside it. Investors paid roughly $1.25M per FTE at pre-seed, ~$1.5M at Series A, then it dips to ~$1.3M at Series B before leaping to ~$4.7M at Series C.
Read that again: from pre-seed to Series B — across the entire stretch where companies hire most aggressively — value created per employee actually goes down. The multiple didn't leap until Series C, and it leaped because of proven product-market fit and capital efficiency, not because the team got bigger. In the ACA's words: \"quality/efficiency wins over quantity in many cases.\"
Where efficiency goes to die
The most instructive number is the dip at Series B — and the ACA names the cause: valuation per FTE compresses \"as companies bulk up on go-to-market hires before scale economics kick in.\" That is the exact moment this article is about.
A company raises, the playbook says build the go-to-market team, headcount spikes — but the revenue lags the cost of hiring by quarters. For a measurable window, the company is less efficient per head than before the raise. If you're a $1M–$10M ARR founder staring at a hiring plan, you're standing at the lip of that dip. The question isn't whether you can hire the team. It's whether you've proven the engine that justifies it.
Two-thirds run on fewer than 15 people
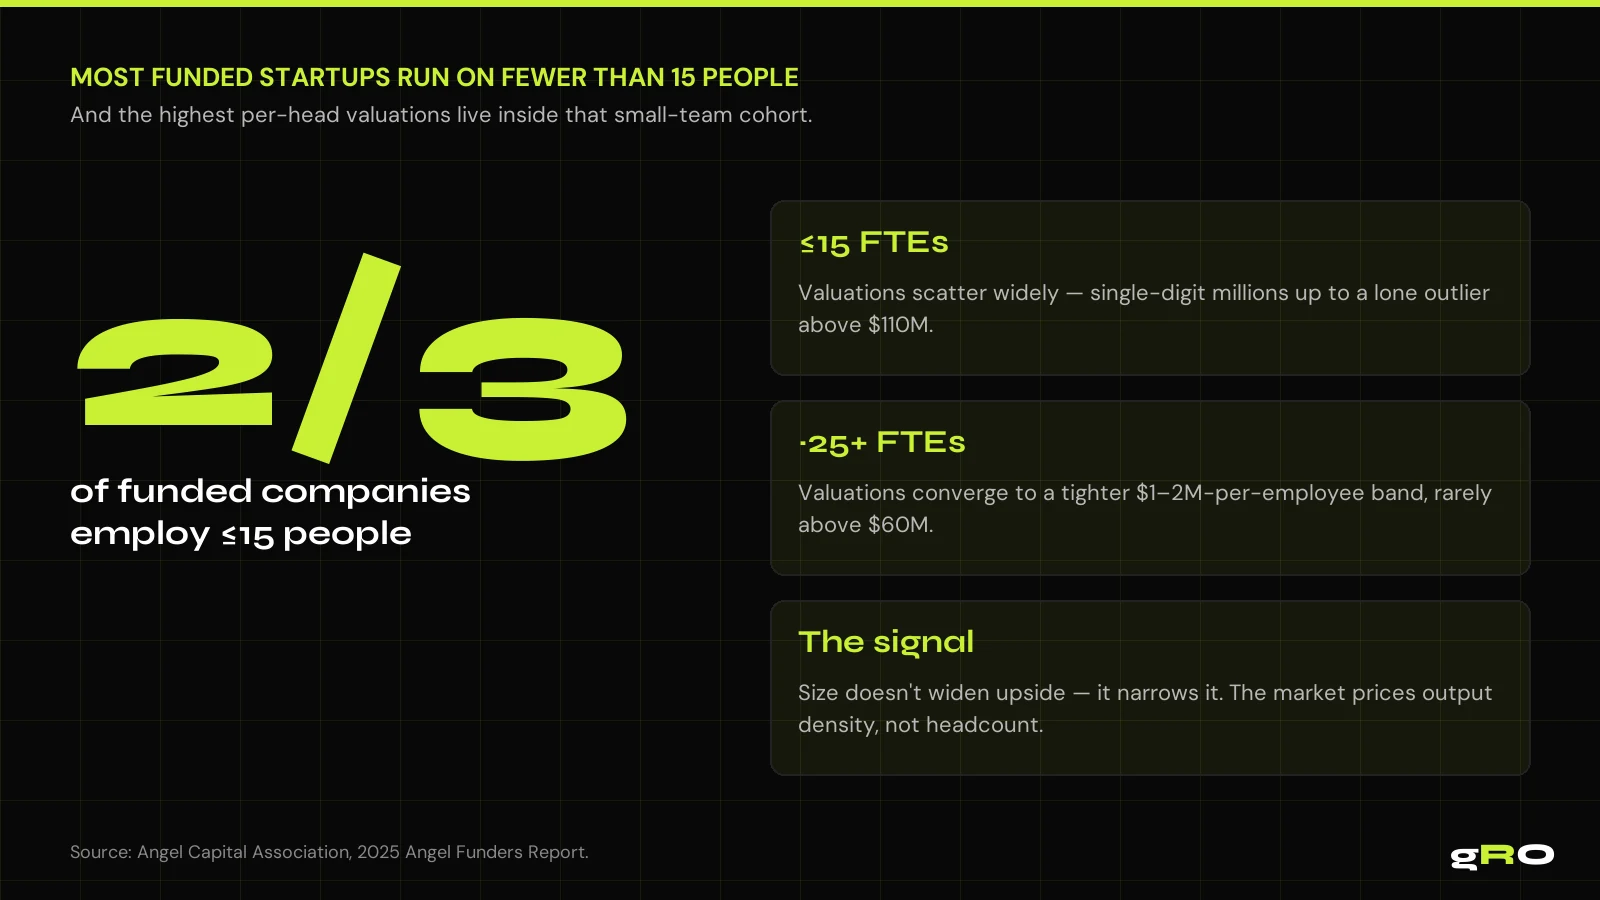
Here's the number that should reframe the conversation: about two-thirds of the funded sample employs 15 people or fewer — and the highest per-capita valuations in the entire dataset live inside that small-team cohort. Past ~25 employees, valuations converge into a tighter $1–2M-per-employee band and rarely exceed $60M.
More people doesn't widen the range of outcomes upward — it narrows it and anchors pricing to conventional metrics. The ACA is explicit about where premiums come from: \"Small, R&D-heavy teams can command lofty per-capita valuations when the story hinges on IP, scarcity, or network effects.\" The premium attaches to leverage — a small group producing disproportionate output — not to headcount.
Value per person, not people
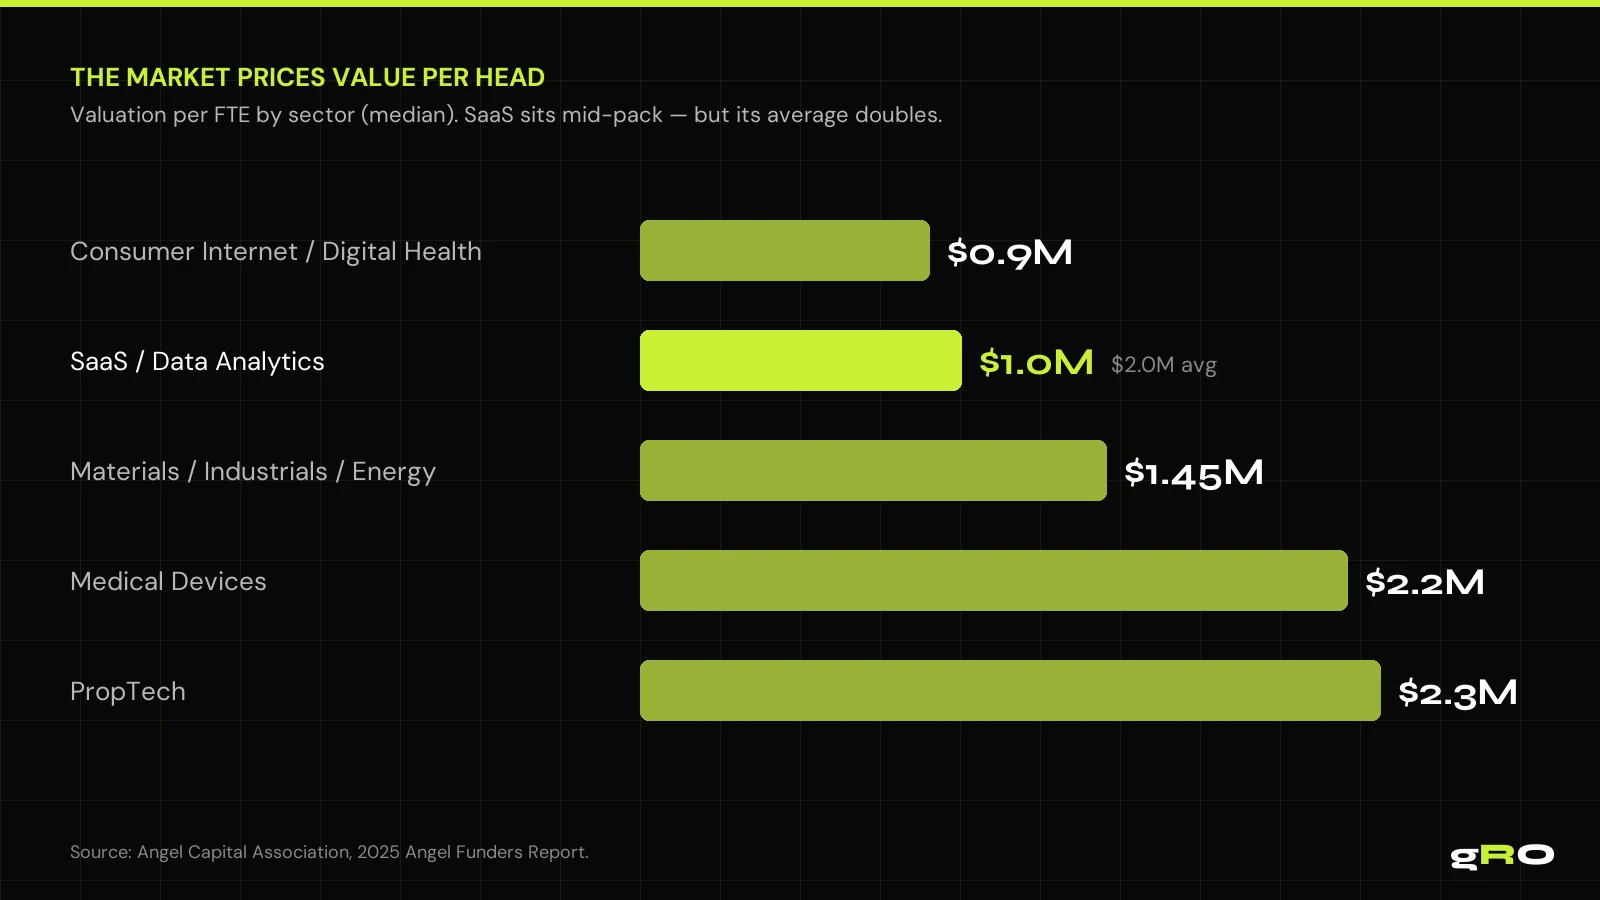
Step back and the through-line is one ratio: value created per person. Industry by industry, the market prices it consistently. SaaS/data analytics sits mid-pack at a $1.0M median per FTE — but its average is double that, $2.0M, a far-right tail of premium-valued platforms. That gap between median and average is the whole game: the premium SaaS companies aren't the ones with the most people, they're the ones producing the most value per person.
The data even names the ceiling on the hiring instinct directly: investors \"appear reluctant to pay beyond about $2M per incremental employee without clear revenue traction.\" Add a head without adding proven revenue, and you're asking the market to pay a premium it has explicitly said it won't.
Output density is what the cap table rewards
This is where the model gRO runs stops being a preference and becomes the arithmetic the cap table rewards. Operator-Led Growth puts one senior operator in ownership of the entire growth function and uses an AI agent fleet to absorb the execution volume that used to require a team. One accountable person owns the pipeline number; the leverage sits in the tooling, not in additional headcount.
It keeps you in the ≤15-person cohort where the highest per-capita valuations live, avoids the Series B dip by refusing to bulk up on go-to-market hires before the engine is proven, and maximizes value per person — the exact ratio the market prices. The hire-to-grow reflex optimizes the org chart. The data optimizes for output density. If your growth has stalled and the reflex is to write a hiring plan, run the other math first: what would it take to prove the engine works, efficiently, before you add a single box to the chart?
Sources cited in this analysis
- Angel Capital Association — Team Size and Impact on Valuation (2025 Angel Funders Report, ~1,000 companies)
- Mercury — The New Economics of Starting Up 2025 (lean-team context)